Affiliate Program KPIs in the United States: Best Practices, Benchmarks, and Common Pitfalls

If you manage a mature affiliate program in the US, KPIs are your operating system. In 2025, winning programs anchor targets to reliable sector benchmarks, measure incrementality beyond last-click, enforce fraud/compliance guardrails, and manage partner lifecycle health with the same rigor as revenue. This guide condenses peer-tested practices I’ve used across multi-million-dollar US programs—what to track, what “good” looks like now, how to set targets, and the pitfalls that quietly erode ROI.
The KPI stack that runs a US affiliate program
Focus your dashboards on KPIs that directly inform decisions. Keep definitions tight and tie each metric to a lever you’ll actually pull.
- Click-through rate (CTR): Share of impressions that click. Use it to judge creative relevance and placement quality, especially on social/creator formats. Directional ranges vary widely by vertical and format.
- Conversion rate (CR): Share of clicks that convert. Drives commission guardrails and landing page/testing priorities. Expect material device and partner-type differences.
- Average order value (AOV): Revenue per order. Influences promotional mix, bundles, and tier thresholds.
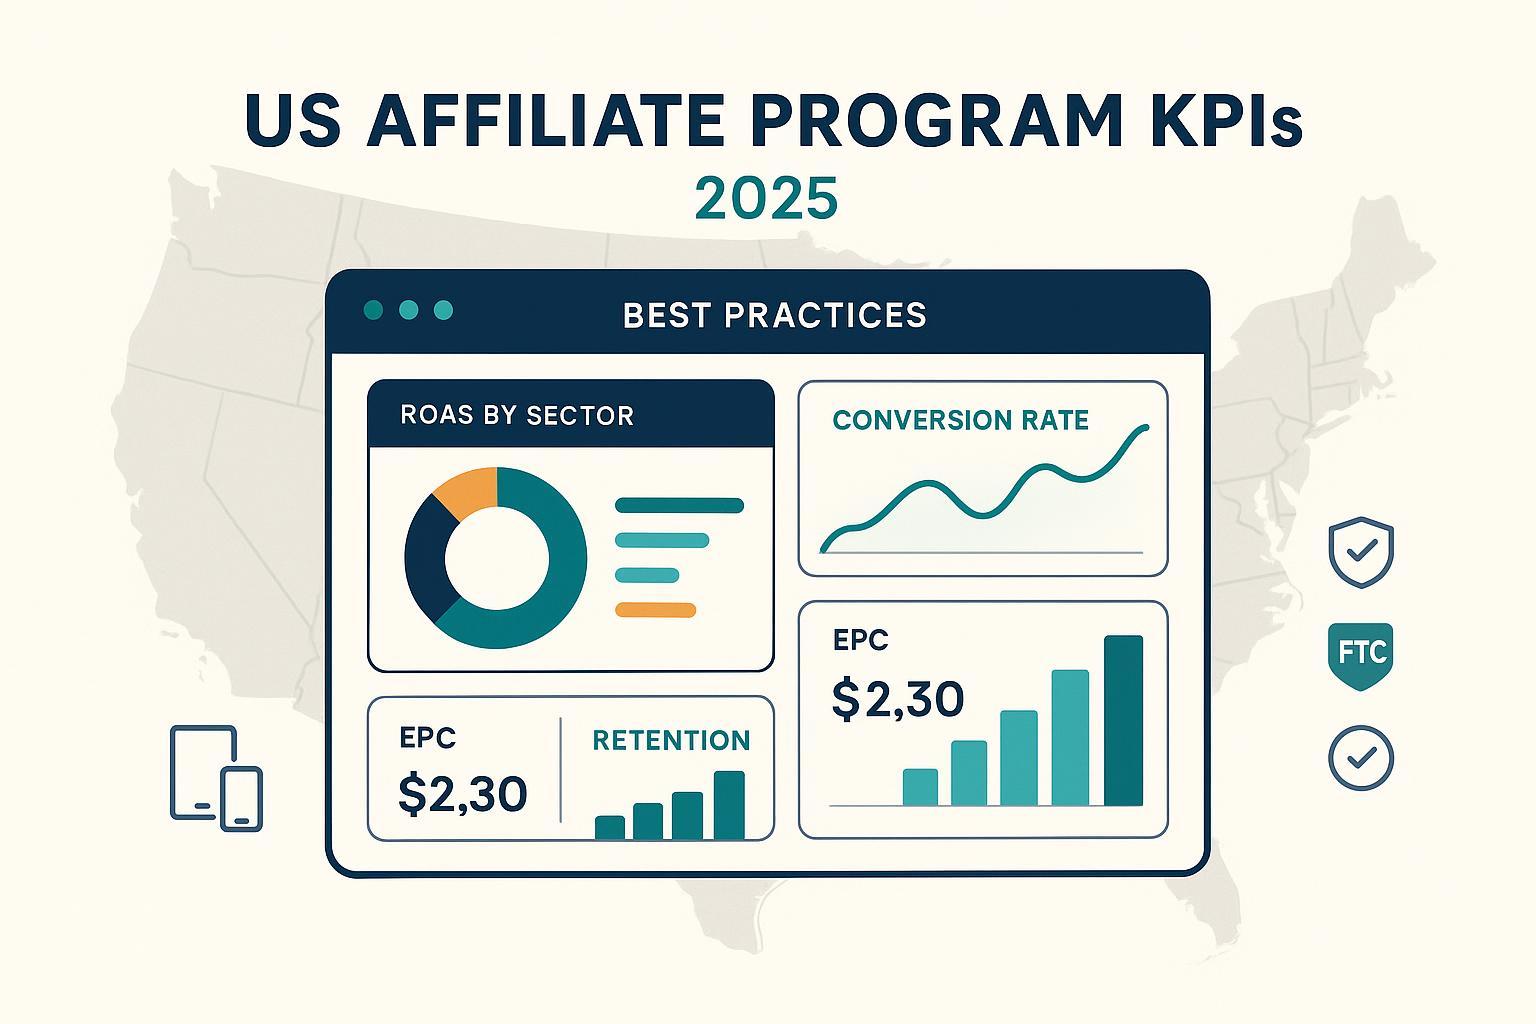
- Earnings per click (EPC): Commission/earnings per click at partner or offer level. Helps prioritize publisher mix and content formats.
- Return on ad spend (ROAS): Revenue divided by affiliate spend (commissions, bonuses, platform fees). Your board-level efficiency metric.
- New customer rate (NCR): Percent of orders from first-time buyers. Guide bonuses and tiering toward incremental growth.
- Customer lifetime value (CLTV) vs. CAC: Guardrail for commission policy; don’t over-incentivize low-LTV segments.
- Approval rate: Percent of applications approved. Keep SLAs tight (24–48h) and bias toward testing. Gate by traffic sources, not just domain size.
- Incremental lift: Measured via controlled tests; the additional conversions you wouldn’t have achieved without the affiliate touch.
- Partner lifecycle KPIs: Activation rate (first click/order within 30–60 days), quarterly active rate, retention/churn, and tier migration speed.
Each KPI should map to an action. For example, low CR at content partners implies landing page fixes, deep links, and offer realignment; high EPC at a niche publisher may justify private bonuses; ROAS trails sector ranges—time to re-balance mix and tighten commission floors.
2025 US benchmarks you can trust (and how to use them)
Public, network-published CTR/CR/EPC/device-split figures remain sparse. The most authoritative 2025 US benchmark available is ROAS by vertical from the PMA’s latest industry study, corroborated by AIM’s sector analysis.
- According to the PMA 2025 Industry Study using 2024 US data, affiliate ROAS typically clusters by sector—Travel is highest, Retail is solid, and Entertainment/Healthcare are mid-range.
- AIM’s 2025 overview corroborates sector patterns and retail subcategories (e.g., department stores, office supplies) with strong ROAS performance; use PMA as primary and AIM as corroboration. See AIM ROAS Benchmarks 2025.
Here’s a practical ROAS table you can adopt for target-setting and finance alignment. Treat these as directional starting points and validate against margins and your own historicals.
| Sector / Subsector | ROAS guide (revenue per $1 affiliate spend) |
|---|---|
| Travel | ~$19 |
| Retail (overall) | ~$11 |
| Entertainment/Media | ~$5–$6 |
| Healthcare/Pharma | ~$5–$6 |
| Dept. Stores (retail sub) | ~$21 |
| Office Supplies (retail sub) | ~$20 |
| Automotive Parts (retail sub) | ~$19 |
Notes:
- CTR/CR/EPC: Use your program medians and top quartiles for targets. Many retail programs see 1–2% CR on average, while top affiliates can exceed 5–10%. EPC varies dramatically by niche and commission model.
- Device split: Expect desktop to convert higher than mobile; set device-adjusted CR targets and optimize mobile flows aggressively.
A quarterly KPI target-setting workflow that holds up under scrutiny
Use a consistent, finance-aligned process every quarter. This keeps KPI targets defensible and actionable.
- Pull 4–6 quarters of data segmented by device (mobile/desktop), partner type (content, deal/coupon, loyalty/cashback, influencer), funnel role (upper/mid/lower), and new vs. returning customers.
- Map your current ROAS by segment to the sector ranges above; flag underperforming segments with adequate volume. Align with finance on margin floors and target ROAS bands (e.g., Retail content partners ≥12x; coupons ≥10x; travel meta ≥18x).
- Derive CR/AOV/EPC targets using internal medians and top quartile. Example: If content partners’ median CR is 1.5% and top quartile is 3.2%, set a Q3 target at 2.4–2.8% with a landing page fix plan.
- Build incrementality tiers and commission policy. Example tiers: High-incremental (new customer heavy) earns CPAi +10–20%; Mid tier at baseline CPA; Low-incremental (brand-bidding or deal stackers) capped commission and tighter attribution rules.
- Publish partner-facing goals: monthly activation targets, quarterly new customer targets, and offer calendar. Communicate how partners can tier up and what bonuses are available.
- Lock reporting cadence: weekly operational dashboards; monthly partner mix and KPI reviews; quarterly finance review of ROAS vs. margin.
A numeric example for retail content partners:
- Baseline: ROAS 9.8x, CR 1.6%, AOV $85, EPC $0.35.
- Target: ROAS 12x, CR 2.4%, AOV $92, EPC $0.48.
- Plan: 3 LP tests (value props, social proof, shipping cutoff), deep links to best-sellers, private code with +5% limited-time bonus, and creator collabs for top-5 SKUs.
Advanced measurement in 2025: incrementality plus MTA/MMM
Last-click alone misprices partners. In 2025, combine controlled experiments for incrementality with smarter multi-touch attribution and MMM for privacy-resilient planning.
- Incrementality tests: Define hypotheses and run RCTs or geo holdouts quarterly on top segments. Guard against seasonality and promo bias. Rakuten’s 2024 eBook outlines a practical four-phase approach—objective setting, test design, execution, analysis—see Rakuten Advertising’s 2024 incrementality eBook.
- AI-enhanced attribution: Weight assists and mid-funnel content to prevent over-crediting last-click coupons. Integrate with your data warehouse and unify CRM/e-comm signals.
- Cadence: 1–2 tests per quarter with pre-registered guardrails; refresh your attribution weighting semiannually.
When you need proof points for non-last-click investments, combine experiment outcomes with partner-level KPI shifts and cohort LTV. For persuasive case evidence, review a US brand outcome where credit card-linked offers drove +49% ROAS and +40% AOV with measurable incremental lift in late 2023—see Rakuten’s Ashley case study (2023/2024).
Mobile and influencer-integrated affiliate in 2025
Mobile now drives the majority of affiliate traffic in many programs, with creators and short-form video playing an outsized role.
- Trend signals: Creator-driven commerce and micro-influencers continue to perform in 2024–2025 within affiliate ecosystems; see Taboola’s 2025 affiliate trends hub.
- Device reality: Multiple industry analyses point to mobile accounting for over half of traffic, while desktop often converts higher. A 2025 round-up highlights this gap and the need for mobile-first optimization—see OptinMonster’s 2025 affiliate stats overview.
- Deep links and app links; reduce intermediate redirects.
- Form autofill, wallet payments, and lightweight pages; test vertical video creatives and shoppable short-form.
- Set device-adjusted CR targets and monitor cross-device assists; report CTR/CR/AOV/EPC split by device and partner type monthly.
Fraud and compliance guardrails you cannot skip
Fraud risk is real and rising across digital channels, with mobile invalid traffic and bots a persistent threat. Layer controls and document enforcement.
- Exposure context: AI-augmented fraud tactics drove significant waste in 2024–2025 across mobile media; review patterns and controls via AppsFlyer’s AI ad fraud overview (2024/2025).
Operational controls to deploy:
- Tooling: always-on IVT/bot monitoring, velocity anomaly alerts, referrer/subID validation, conversion-quality thresholds.
- Policy: traffic source disclosure, paid search rules (brand term restrictions, negatives), coupon code governance (private, channel-specific), explicit clawback provisions.
- Process: pre-approval vetting, quarterly audits of top partners’ placements, tracking/cookie audits, and network compliance suites.
Compliance basics for US programs:
- FTC Endorsement Guides (updated 2023): Disclosures must be clear, conspicuous, proximate, and unavoidable; platform tools alone are often insufficient. See the FTC’s 2023 press release on the updated Endorsement Guides.
- California CPRA/CCPA & Global Privacy Control (GPC): Honor GPC opt-out signals; provide “Do Not Sell or Share” options and disclose tracking practices. Start with the California DOJ’s GPC page.
- IRS 1099-NEC: Issue Form 1099-NEC for $600+ nonemployee compensation to US affiliates; file and furnish by Jan 31. Reference IRS About Form 1099-NEC for current instructions.
Partner lifecycle KPIs and tiering playbook
The fastest path to durable ROAS gains is often better lifecycle management—not just signing more partners.
- Activation (first 30–60 days):
- 24–48h approvals, welcome kit (top 5 SKUs/links, promo calendar, UTM/deep link templates), sample creative pack, and a 30-day content plan.
- Weekly nudges for non-activated partners (how-to, content prompts, deep-link suggestions).
- Segmentation and tiering:
- VIP (top 10–20 partners by new customer revenue), Developing (mid-tail with growth signals), Long Tail (scalable enablement).
- Publish transparent thresholds—e.g., three-month rolling revenue or new customer counts—and auto-upgrade with temporary CPAi boosts.
- Retention and engagement:
- Quarterly business reviews (QBRs) for VIPs; mid-funnel content partnerships; private codes and limited-time offers; new customer bonuses; prompt creative refresh.
- Sunset and reactivation:
- Define non-compliance/saturation triggers; run targeted reactivation with updated bundles and content formats; remove chronically non-compliant partners.
Lifecycle targets to try:
- Activation rate: 10%+ in 30 days for newly approved; top programs reach 30–50% with strong enablement.
- Quarterly active rate: 20–40% for retail content programs with ongoing promos; baseline and improve.
- Churn: Aim for <10–20% quarterly churn among active partners; deploy reactivation plays.
Common pitfalls and the corrective actions
- Over-reliance on last-click coupons: Starves content/influencer partners. Correct with incrementality tiers and non-last-click weighting.
- Commission policy misaligned with CLTV: High CPA on low-LTV cohorts crushes margin. Add CLTV/CAC guardrails and variable CPAi.
- Ignoring mobile UX: High mobile traffic with desktop-first flows depresses CR. Fix deep links, speed, autofill, wallet payments.
- Lax paid search policing: Brand bidding cannibalizes direct. Enforce brand-term rules and clawbacks.
- Weak onboarding and content enablement: Low activation and stale creatives. Ship welcome kits, content calendars, and quarterly refreshes.
- Compliance misses: Inadequate disclosures or privacy controls. Train partners on FTC/CCPA rules and audit periodically.
A 90-day optimization plan you can run now
Weeks 1–2
- Data pull and segmentation; baseline KPIs by device/partner/funnel/new vs. returning.
- Finance alignment on ROAS bands and margin floors; publish Q targets.
Weeks 3–6
- Launch two LP tests and implement deep links/app links for top partners.
- Ship welcome kits and content packs; set activation nudges; introduce tier criteria and bonuses.
- Stand up IVT monitoring and paid search rules; audit coupon governance.
Weeks 7–10
- Run one incrementality test (geo/RCT) on a priority cohort; pre-register hypotheses and guardrails.
- QBRs with top 10–20 partners; negotiate private codes and new customer bonuses.
- Refresh creator content and short-form video; track device-adjusted CR.
Weeks 11–13
- Analyze test results; adjust commission tiers; publish partner scorecards.
- Report ROAS vs. margin by segment; document fraud/compliance incidents and enforcement actions.
- Set next quarter targets and experiment roadmap.
Final thought
In 2025, the most resilient US affiliate programs treat KPIs as an end-to-end operating system—benchmarks to set targets, experiments to prove incrementality, lifecycle discipline to sustain performance, and compliance/fraud controls to protect ROI. Run the workflow, mark your trade-offs, and iterate quarterly.
References embedded above: PMA (2025), AIM (2025), Rakuten (2024/2023), Taboola (2025), OptinMonster (2025), AppsFlyer (2024/2025), FTC (2023), California DOJ (current), IRS (current).