Who is this for? Small B2B SaaS marketing leaders who need a reproducible way to prove how content drives SQLs, pipeline, and payback—without hiring a huge team. Our North Star throughout is simple to say and exacting to implement: Content‑Influenced Pipeline. We’ll anchor the hands‑on walkthrough in first‑touch attribution so you can build it today, then show parity views (W‑shaped and time‑decay) so finance can sanity‑check the results.
How to make content attribution ROI real with Content‑Influenced Pipeline
Content‑Influenced Pipeline is the total pipeline value from opportunities that include at least one tracked content touch before SQL (or opportunity creation). To avoid fuzzy math, document three guardrails up front:
The lookback window. Choose 30/60/90/180 days based on your buying cycle. Keep it consistent by cohort.
Exclusions. Strip out brand‑nav/system pages, untagged redirects, and internal traffic. Normalize all first‑touch pages into a canonical content key.
Identity stitching. Capture email on key assets and reconcile pre‑form sessions when policies allow. Without identity stitching, “influenced” collapses to last‑touch anecdotes.
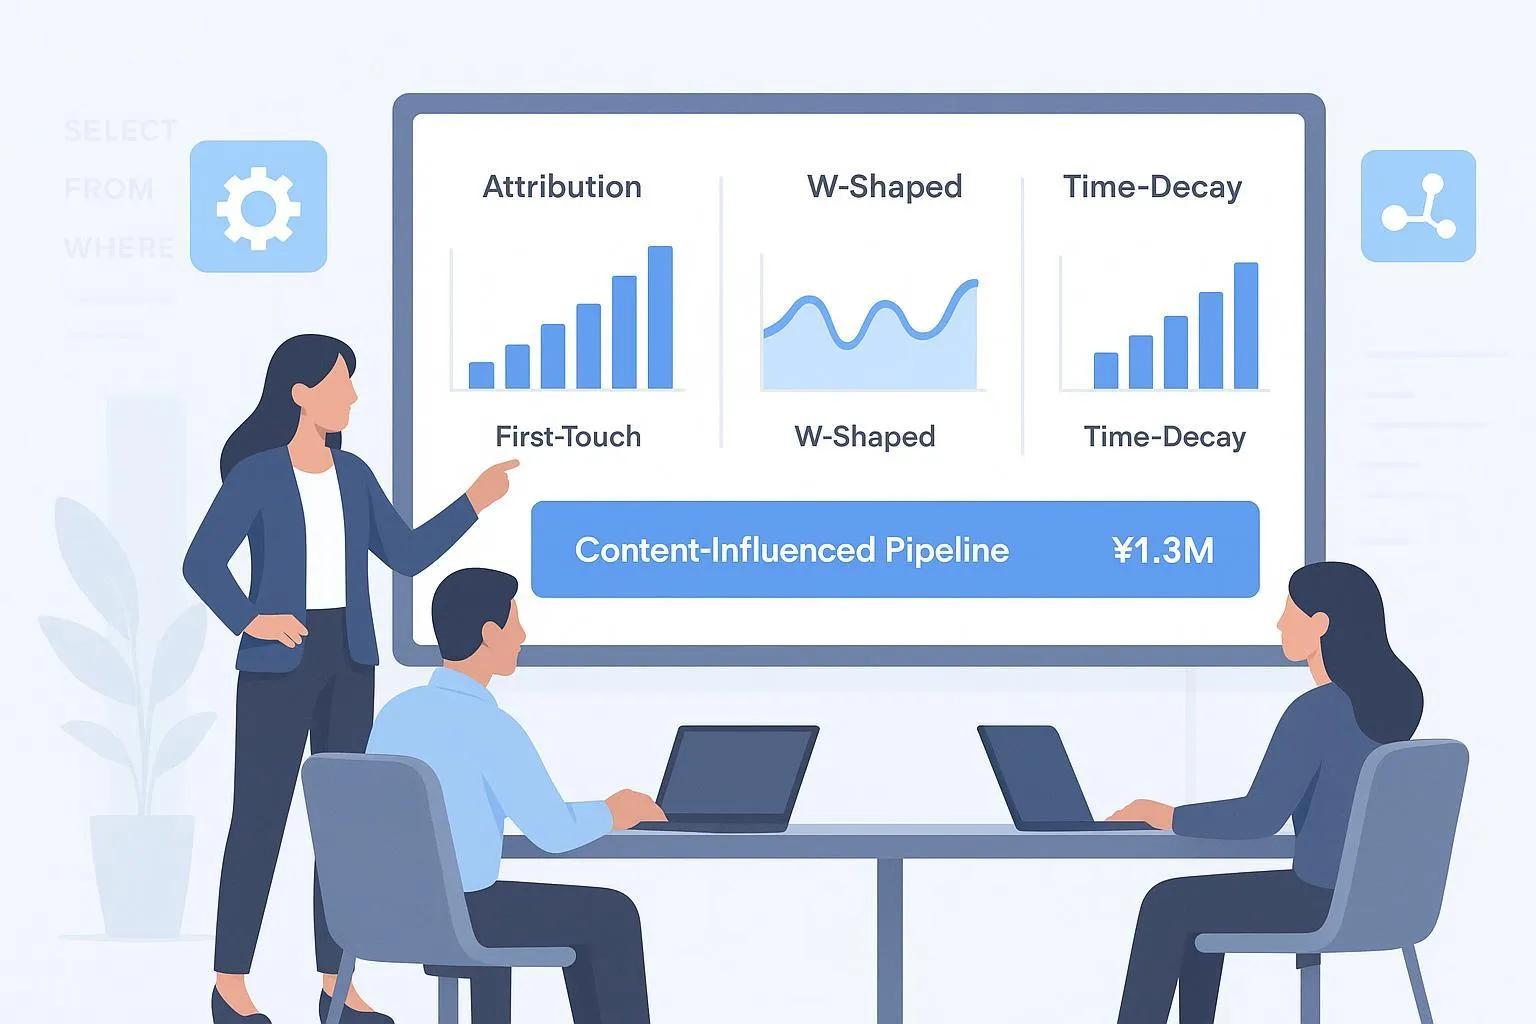
In this guide we’ll say “influenced” broadly, but the anchor examples use first‑touch credit so you can deploy quickly. As you mature, compare against W‑shaped and time‑decay models to see how the story shifts.
Pro tip: Make the KPI name explicit in dashboards—“Content‑Influenced Pipeline (model: First‑Touch; window: 90d)”—so no one confuses modeling changes with performance changes.
Attribution models you’ll actually use in SMB B2B SaaS
First‑Touch (anchor for walkthrough). Assigns 100% of credit to the earliest qualifying interaction that brought the contact into your funnel. It’s excellent for discovery diagnostics—what content starts high‑value journeys—but it ignores nurturing. HubSpot’s reporting supports this natively; see the official instructions to create attribution reports and the Campaign Attribution tab for model‑based views.
W‑Shaped. Credits the first touch, the moment a lead is created (or MQL), and the SQL/opportunity creation—often 30/30/30—with the remaining 10% spread across assists. It aligns with B2B inflection points and is widely documented by neutral explainers such as Mountain and Adobe.
Time‑Decay. Gives more weight to recent touches using an exponential curve (weights roughly follow 2^(−t/half‑life) and normalize to 100%). It’s useful for long cycles where late‑stage content persuades; Adobe’s model component descriptions are a solid primer.
Sensitivity testing cadence. Once your base reports run, compare models quarterly on the same cohorts. Identify clusters whose ROI shifts materially across models; that’s a cue to refine tagging or content mix.
Tagging governance and the minimum viable data model
Clean inputs drive credible ROI. Standardize UTMs and content keys, then persist them all the way into CRM and your warehouse.
UTM template. Lowercase values for utm_source, utm_medium, utm_campaign (use for content cluster), utm_content (asset ID + intent tier), plus utm_id and source_platform where relevant. Guard against stale overwrites by persisting the initial UTM set for first‑touch and allowing a separate last‑touch set to update.
Canonical content key. Normalize page paths and UTMs into a key like cluster|content_id|intent. Exclude /pricing, /login, and system endpoints. Keep the normalization logic in code and your warehouse.
Identity stitching. Enforce email capture on key assets. Where privacy policies allow, reconcile anonymous sessions with a clientID mapping after form fill.
Here’s the data flow we’ll be implementing—from content touches to dashboards:

Practical micro‑example with QuickCreator. If your team uses QuickCreator to tag assets by cluster and intent at publish time, those tags can travel with form submissions, sync to HubSpot as contact properties, and flow into Looker to filter tiles by cluster and compute attributed ARR under different models. This is one way to operationalize clean lead attribution without changing your CRM architecture.
Side note on agentic governance. If you’re weighing generic AI writing tools versus an agentic content system that preserves tags and provenance through research → writing → distribution, this comparison of AI agents vs AI writers on the QuickCreator blog explains the workflow trade‑offs.
HubSpot implementation anchored to First‑Touch
We’ll keep this lean so you can ship in an afternoon.
HubSpot objects and field setup
Define the Contact properties you’ll need: First Page Seen and Original/Latest Source (native), plus two customs—First Content Touch (a normalized key) and Pre‑SQL Content Touches (an array or delimited text). Associate Contacts to a primary Company, and ensure Deals capture an SQL Created Date or a stage that denotes first SQL. As lifecycle stages change, snapshot pre‑SQL touches so multi‑touch analyses have reliable context.
Build a first‑touch pipeline report
In Reports → Create report → Attribution, choose Deals as the data source and First‑Touch as the model.
Filter Deal Stage to “SQL Created” or your equivalent, and set the date window (e.g., 90 days). Add a filter to include opportunities whose associated contact has a First Content Touch value.
Break down by your normalized content key or by Content Cluster. Save the report as “Content‑Influenced Pipeline (First‑Touch, 90d).”
Campaign‑scoped view. On any HubSpot campaign, use the Attribution tab to view first‑touch contributions by assets in that campaign.
A compact dashboard layout that works well

Keep tiles simple:
Content‑Influenced SQLs by Cluster (bar)
SQL Conversion Rate by Entry Content (table)
Content‑Assisted Win Rate (single value)
Payback by Cluster (line)
Warehouse SQL and Looker patterns you can copy
Start by normalizing first content touch per contact within a lookback window, then join to opportunities. Adapt the field names to your schema.
-- Example: Normalize first content touch and attribute ARR (Postgres/BigQuery style)
WITH pre_sql_touches AS (
  SELECT
    t.contact_id,
    t.content_key,            -- normalized key: cluster|asset|intent
    t.touch_ts,
    ROW_NUMBER() OVER (PARTITION BY t.contact_id ORDER BY t.touch_ts ASC) AS rn
  FROM fact_touchpoints t
  WHERE t.touch_ts >= TIMESTAMP_SUB(CURRENT_TIMESTAMP(), INTERVAL 90 DAY)
    AND t.is_content = TRUE
    AND t.is_system_page = FALSE
), first_touch AS (
  SELECT contact_id, content_key, touch_ts
  FROM pre_sql_touches
  WHERE rn = 1
), contacts_to_opps AS (
  SELECT DISTINCT
    c.contact_id,
    o.opportunity_id,
    o.sql_created_ts,
    o.attributed_arr           -- ARR or revenue you’ll attribute per model
  FROM dim_contacts c
  JOIN fct_opportunities o ON o.account_id = c.account_id
  WHERE o.sql_created_ts >= TIMESTAMP_SUB(CURRENT_TIMESTAMP(), INTERVAL 90 DAY)
), joined AS (
  SELECT
    f.content_key,
    o.opportunity_id,
    o.attributed_arr
  FROM first_touch f
  JOIN contacts_to_opps o ON o.contact_id = f.contact_id
  WHERE f.touch_ts <= o.sql_created_ts      -- touch must precede SQL
)
SELECT
  content_key,
  SUM(attributed_arr) AS ft_attributed_arr
FROM joined
GROUP BY 1
ORDER BY ft_attributed_arr DESC;
To let analysts switch models in Looker without duplicating Explores, add a simple parameter and route logic with Liquid.
# LookML sketch: parameterized attribution measure with symmetric aggregates
explore: attribution {
  joins: [
    { name: fact_touchpoints, relationship: many_to_many, type: left_outer },
    { name: dim_content, relationship: many_to_many, type: left_outer },
    { name: fct_opportunities, relationship: many_to_many, type: left_outer }
  ]

  parameter: attribution_model {
    type: unquoted
    allowed_value: { label: "First-touch" value: "first_touch" }
    allowed_value: { label: "W-shaped" value: "w_shaped" }
    allowed_value: { label: "Time-decay" value: "time_decay" }
    default_value: "first_touch"
  }

  measure: attributed_revenue {
    type: sum
    sql: CASE
      WHEN {% parameter attribution_model %} = 'first_touch' THEN ${fct_opportunities.arr_ft}
      WHEN {% parameter attribution_model %} = 'w_shaped' THEN ${fct_opportunities.arr_w}
      WHEN {% parameter attribution_model %} = 'time_decay' THEN ${fct_opportunities.arr_td}
      ELSE ${fct_opportunities.arr_ft}
    END;;
    value_format_name: usd
    label_from_parameter: attribution_model
  }
}
Tip: Avoid fanout by setting primary keys and using symmetric aggregates; Looker’s relationship parameter pattern explains the fix.
Payback math that finance will accept
Assumptions for this guide
Cost basis: content‑only variable costs (writers, design, distribution) inside a 6‑month window.
Revenue basis: Attributed New ARR from deals with pre‑SQL content touches, credited per the active model. For higher rigor, apply your gross margin.
Formula
CAC Payback (months) = 12 × (Content Variable Costs in 6 months) / (Attributed New ARR in same 6‑month cohort)
Worked example
Costs: $120,000 over six months
Attributed New ARR (first‑touch model): $300,000
Payback ≈ 12 × 120,000 / 300,000 = 4.8 months
Sensitivity note. If you reallocate credit with a W‑shaped model, top‑of‑funnel clusters often lose some credit, and late‑stage pieces gain. A time‑decay view can shift even more toward late touches. The point isn’t to pick a “true” model; it’s to show a band of plausible outcomes around your North Star.
Leading indicators that predict your North Star
Track a compact set you can actually act on:
Content‑driven MQLs and the MoM Lead Velocity Rate. As a forecasting input, it helps you spot future pipeline direction early.
Contact → SQL conversion rate by content cluster. Use the first‑touch entry to bucket contacts, then compute conversions and velocity by bucket.
Assist rate on demo bookings. If pre‑SQL content touches correlate with booked demos, that’s a strong signal you’re educating the right buyers.
SQL velocity (days to SQL) segmented by entry content. Faster isn’t always better, but a stall is a warning sign.
Average SQL value by entry content. Pair this with win rate to identify premium clusters.
Opportunity win rate with pre‑SQL content assists versus without. A simple binary split is often eye‑opening.
Keep thresholds relative to your own history. Industry “averages” are noisy—use them as directional only.
Governance and next steps for agentic operations
Here’s the deal: measurement sticks only if governance is as deliberate as your dashboards. Automate tag persistence from research → writing → distribution, schedule your warehouse jobs, and set quarterly model comparisons as a ritual. If you’re considering how agentic workflow governance differs from standalone writers, this short piece on agents versus writers on the QuickCreator blog offers a useful lens.
Put it into motion this week
Ship the first‑touch HubSpot dashboard.
Stand up the warehouse query and a minimal Looker Explore with an attribution model parameter.
Document your 6‑month cost basis and publish the payback tile.
Run one sensitivity comparison to W‑shaped and time‑decay and capture what changes.
Think of it this way: once Content‑Influenced Pipeline is live and trusted, campaign debates shift from “did content do anything?” to “which cluster deserves the next dollar—and why?” That’s a conversation you can win with data.