Weekly Social Media KPI Dashboard Structure (United States): Impressions, Engagement Rate, CTR, Saves, Shares

Use this practical, step-by-step checklist to build and maintain a weekly social media KPI dashboard that is U.S.-focused and platform-agnostic. It covers the essential metrics—impressions, engagement rate (ER), click-through rate (CTR), saves, and shares—while keeping paid and organic separate and comparable across Instagram, Facebook, X (Twitter), and LinkedIn.
1) Set your weekly governance (one-time, then review quarterly)
- Confirm your week boundary and timezone. Define a fixed week (e.g., Monday–Sunday) and a single timezone (e.g., U.S. Eastern) for all platforms. Why it matters: keeps your week-over-week comparisons clean and reliable.
- Document KPI definitions. Write concise definitions for impressions, reach, engagements, ER, CTR, saves, and shares. According to the 2025 Hootsuite guide on calculation methods, standard ER formulas include ER by impressions (engagements ÷ impressions × 100%) and ER by reach (engagements ÷ reach × 100%) see the Hootsuite 2025 engagement rate formulas. Complement with clear engagement components per platform, aligned with the Sprout Social 2025 metrics glossary.
- Decide your primary ER formula. Pick ER by impressions or ER by reach and use it consistently every week. Note the choice in your dashboard’s “Definitions” tab.
- Define “engagements” for consistency. Include likes/reactions, comments, shares, saves, and link clicks (confirm platform availability). This prevents drift in what’s counted week to week.
- Separate paid vs. organic everywhere. Establish two distinct datasets and visuals. Why it matters: it avoids double counting and clarifies what’s driving performance.
- Set a U.S.-only scope. Confirm the U.S. geo focus in your reporting policy and note any platform limitations (e.g., where organic country splits aren’t natively available).
2) Collect weekly data (U.S.-filtered where supported) — by platform
Use the same week window and timezone as defined above. Always export or query paid and organic separately.
Instagram (Meta)
- Pull organic post metrics: impressions, likes, comments, shares, saves, link clicks (where available), reach. In the Instagram app for Professional/Creator accounts, you can view per-post metrics including saves and shares; the Audience tab shows Top Locations by country such as United States (Instagram Help, 2025) via view account and ad insights.
- Pull paid (ads) metrics from Ads Manager: impressions, clicks, CTR, saves/shares (if captured in engagement). Use country targeting and breakdowns in Ads Manager to ensure U.S. scope.
- Note: Meta has adjusted certain Instagram metrics over time; re-validate fields quarterly per the Hootsuite Help notice on Instagram metric changes (April 17, 2025).
Facebook (Meta)
- Pull organic Page metrics from Business Suite/Insights: impressions, reach, reactions, comments, shares, link clicks. For U.S. reach/impressions at Page level, Meta’s Graph API supports country breakdowns (e.g., page-level country unique metrics) as referenced in the Meta Graph API Insights documentation (2025).
- Pull paid metrics from Ads Manager: impressions, clicks, CTR, reactions, comments, shares. Apply U.S. targeting and confirm a country breakdown in the delivery reports.
X (Twitter)
- Pull organic post metrics from native analytics: impressions, likes, replies, retweets, link clicks. Note: robust U.S.-only breakdowns for organic are limited.
- Pull paid metrics from Ads Manager: impressions, clicks, CTR, engagements. Use U.S. targeting and confirm the country settings; see the X Business Help on geo targeting (2025).
- Pull organic Company Page metrics: impressions, reactions, comments, shares, clicks; record reach if available. Organic country splits are limited; rely on follower/location insights for context.
- Pull paid metrics from Campaign Manager: impressions, clicks, CTR, reactions, comments, shares. Microsoft’s official overview confirms available sponsored content metrics and reporting fields; reference the LinkedIn Ads reporting overview on Microsoft Learn (2025).
Pro tip: Keep an “Extract Log” noting sources, date ranges, filters, and any known caveats (e.g., sampling, partial updates). It speeds up QA and future audits.
3) Calculate the KPIs with standard formulas
Use one ER formula consistently. Add the exact formulas below to your dashboard’s calculations sheet.
- Calculate impressions (by platform, by paid vs. organic): Total times your content was displayed. Impressions can include repeat views by the same user; they are typically greater than or equal to reach, as summarized by the 2025 Sprout Social metrics glossary (linked above).
- Calculate CTR: CTR = link clicks ÷ impressions × 100%. Formula aligns with common platform definitions and industry documentation (Hootsuite and LinkedIn documentation standards).
- Calculate ER by impressions: ER (by impressions) = total engagements ÷ impressions × 100%. The Hootsuite 2025 engagement rate formulas describe this widely used method.
- Calculate ER by reach (if you choose reach-based ER): ER (by reach) = total engagements ÷ reach × 100%. Keep it consistent week over week, as also covered in the Hootsuite guidance above.
- Define engagement components explicitly (keep consistent across platforms): likes/reactions + comments + shares + saves + link clicks. If a platform does not expose a component (e.g., saves), document the exception in your “Definitions” tab.
- Tally saves and shares: Where available, use the native fields (e.g., Instagram saves and shares, Facebook shares, LinkedIn shares, X retweets). Treat retweets/reposts as “shares” when you aggregate cross-platform.
Pro tip: If you add profile clicks or video views to “engagements,” do it intentionally and document it; otherwise, your ER will drift.
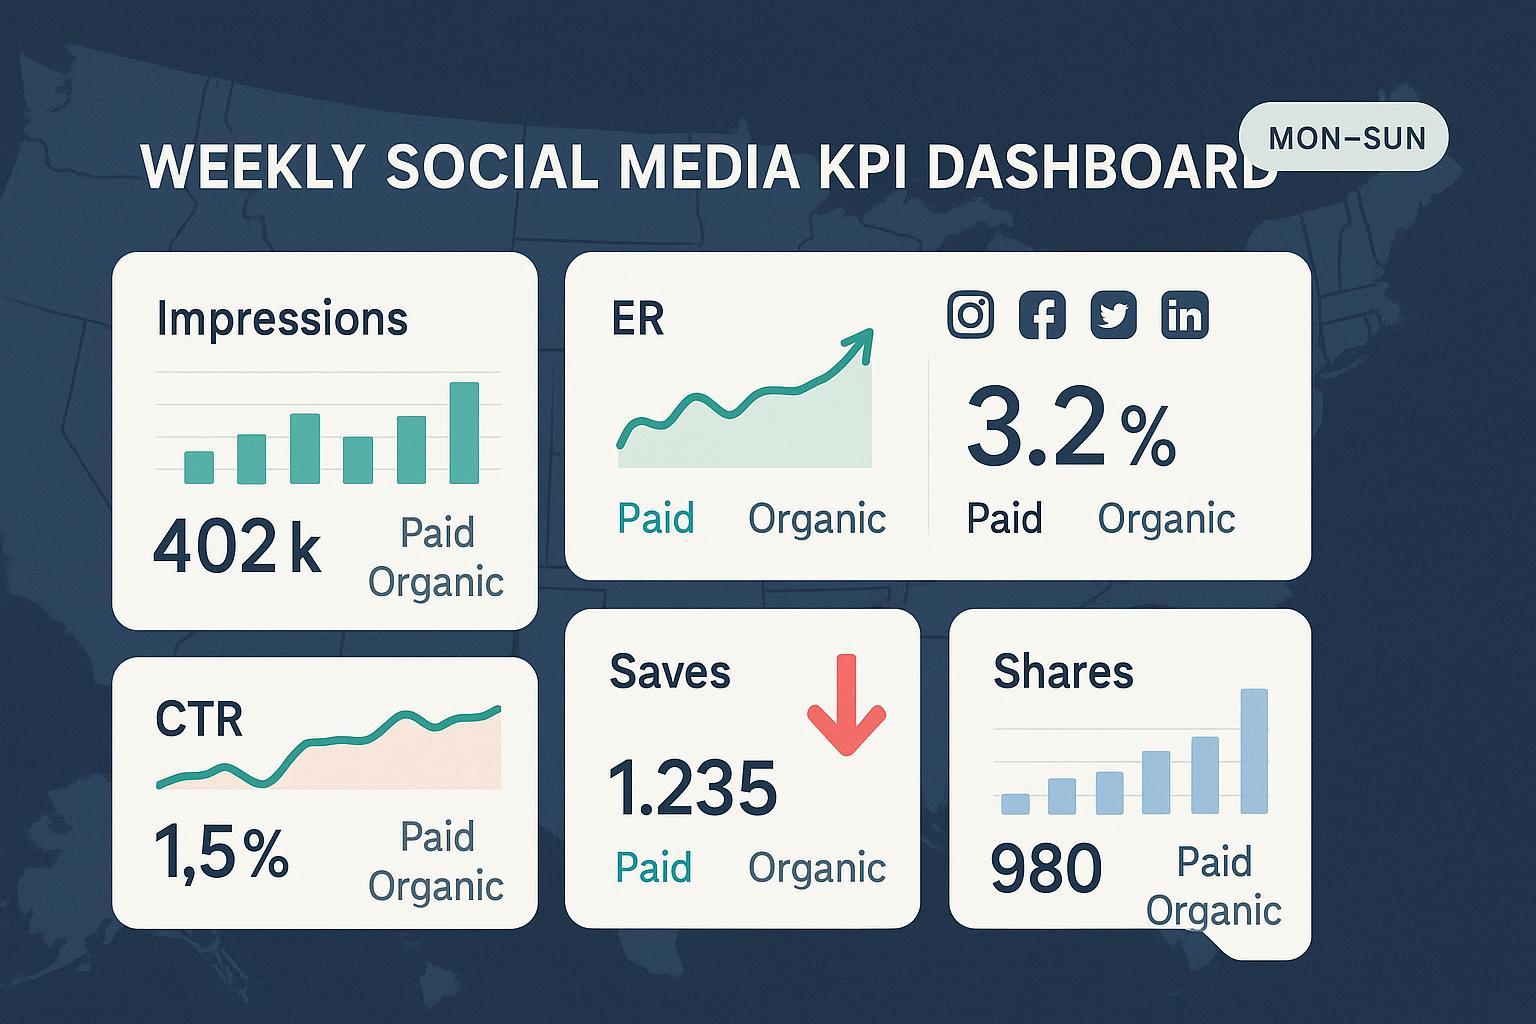
4) Assemble your weekly dashboard (clear, scannable, and U.S.-focused)
- Create a Summary section (this week):
- Impressions (Total, U.S. scope where supported)
- ER (use your chosen method)
- CTR
- Saves
- Shares
- Split each by Organic vs. Paid
- Add Trend views (last 6–12 weeks): Line or bar charts for each KPI, split by paid vs. organic, to visualize momentum.
- Add Platform sections:
- Instagram: Top posts (saves, shares, ER), U.S. paid delivery, organic highlights.
- Facebook: Top posts (shares, link clicks), U.S. country breakdown at Page or campaign level where supported.
- X: Top posts (retweets, CTR), paid performance with U.S. targeting.
- LinkedIn: Top posts (shares, clicks), sponsored content CTR vs. organic ER.
- Insert Definitions & Notes tab: Copy your formulas and any platform-specific exceptions here so viewers can self-serve answers.
- Highlight U.S. scope. Place a visible label like “Reporting scope: United States” at the top of each platform section.
Pro tip: Use consistent colors for paid (e.g., blue) and organic (e.g., green) across all charts and tiles. It helps readers scan quickly without re-learning your visual language.
5) Validate and QA your numbers every week
- Reconcile totals vs. post-level sums. Sum post-level impressions and engagements and compare with account-level totals. Small differences may result from data lag; large gaps should be investigated.
- Check week-over-week deltas. Compute percentage changes for each KPI. Confirm that any spikes or dips align with content or campaign changes. A disciplined process mirrors recommendations from leading reporting guides such as the 2025 Sprout Social reporting playbooks (linked earlier in this article’s metrics and reporting sources).
- Verify your U.S. scope. Ensure all paid datasets use U.S. targeting; verify any available country breakdowns for Meta Pages (see Meta Graph API Insights reference) and LinkedIn Ads reports (see Microsoft Learn overview). For X organic, acknowledge the limitation and clarify methodology.
- Spot outliers with simple rules. Flag any metric that’s ±2 standard deviations from a 6–12 week baseline. Annotate the cause where known (viral post, heavy paid boost, outage).
- Cross-check definitions. Confirm your ER uses the same numerator and denominator as last week; don’t mix reach-based and impression-based ER in the same chart.
- Timestamp and initial every extract. Note who pulled the data and when. It’s invaluable for audits and when numbers are questioned.
6) Interpret results and turn them into actions
- Diagnose drivers. When impressions rise but ER falls, check creative relevance and audience fit; when CTR rises with flat impressions, check link intent alignment and call-to-action clarity.
- Separate paid vs. organic insights. Paid may drive impressions while organic reveals resonance (saves and shares often indicate strong relevance—especially on Instagram, where saves are a known interest signal per Instagram’s own explanation of ranking signals in 2023–2024 and reflected in later 2025 help materials referenced above via Instagram Help).
- Contextualize with U.S. geo. If a spike is paid and U.S.-targeted, you should also see corresponding U.S. website sessions. Use UTM parameters in your URLs to confirm attribution in web analytics.
- Capture one “Action for next week” per platform. Keep it specific (e.g., “Test 2 new hooks on LinkedIn carousels to lift CTR by 0.3 pts”).
7) Archive for continuity and future audits
- Version your report. Name files by the week ending date (e.g., 2025-10-05). Store extracts/CSVs, the dashboard snapshot, and annotations together.
- Keep a changes log. Record definition changes, visualization tweaks, and any platform metric deprecations. When Meta updates metric availability, note it and reference the Hootsuite Help 2025 update on Instagram metrics.
- Refresh quarterly. Re-validate field availability against current docs: Instagram Help for Insights access, Meta Graph API for Page-level country metrics, X Business Help for geo targeting, and Microsoft Learn for LinkedIn Ads reporting.
8) Platform adaptation notes (quick reference)
- Instagram/Facebook (Meta):
- Impressions include paid + organic displays; keep datasets separate.
- Saves (Instagram) are a strong interest signal; include in engagements and report saves explicitly.
- Country-level reporting: Use Ads Manager breakdowns for paid; for Pages, consult country breakdown fields as per Meta Graph API Insights.
- X (Twitter):
- Organic geo splits are limited; clearly disclose if you approximate U.S. exposure from paid or audience context; set expectations with stakeholders and cite the X Business Help geo targeting page as the authoritative paid geo control.
- Retweets/reposts map to “shares” in cross-platform reporting; keep naming consistent.
- LinkedIn:
- ER often uses engagements ÷ impressions × 100%; document if you include clicks inside “engagements.”
- Paid reporting: use Campaign Manager and refer to the Microsoft Learn Ads reporting overview for available metrics.
9) Troubleshooting and common mistakes checklist
- Don’t mix ER formulas. Confirm whether you use ER by impressions or by reach—and keep it that way.
- Don’t merge paid and organic datasets. Always split them at source, then compare side-by-side.
- Don’t forget the U.S. scope. Verify country targeting for paid and any country-level splits where supported for organic.
- Don’t double count engagements. If a platform reports “engagements” that already include clicks, don’t add clicks again.
- Don’t compare unlike-for-like weeks. Maintain the same week boundary and timezone.
- Don’t ignore metric changes. Re-validate field availability quarterly and reference current documentation (e.g., Instagram/Meta updates via Hootsuite Help 2025; Meta Graph API insights pages; X Business Help; Microsoft Learn LinkedIn Ads reporting).
10) At-a-glance formulas (use these verbatim in your sheet)
- CTR = link clicks ÷ impressions × 100%
- ER (by impressions) = total engagements ÷ impressions × 100%
- ER (by reach) = total engagements ÷ reach × 100%
- Engagements (keep consistent) = likes/reactions + comments + shares + saves + link clicks
Source notes and further reading
- Hootsuite (2025): engagement rate methods—see Hootsuite engagement rate formulas
- Sprout Social (2025): definitions of key social metrics—see Sprout Social metrics glossary
- Meta (2025): Page-level country breakdown metrics—see Meta Graph API Insights reference
- Instagram Help (2025): where to view per-post and audience insights—see View account and ad insights
- X Business Help (2025): how to geo-target campaigns—see Geo targeting in Ads Manager
- Microsoft Learn (2025): official LinkedIn Ads reporting overview—see LinkedIn Ads reporting overview
- Hootsuite Help (2025): recent Instagram metric changes—see Changes to Instagram metrics (April 17, 2025)