What is Engagement Rate in GA4? Key Metrics and Insights for Content Marketers

One-Sentence Definition
Engagement Rate in Google Analytics 4 (GA4) is the percentage of sessions during which users actively interact with your site, defined by lasting at least 10 seconds, having 2+ pageviews, or triggering a conversion event.
Detailed Explanation
In GA4, Engagement Rate provides a modern, improved measure of how meaningfully users interact with your website or app. Instead of simply tracking if someone leaves after a single page (as in the old bounce rate metric), GA4 counts a session as "engaged" when at least one of these occurs:
- The session lasts 10 seconds or more
- The user views two or more pages/screens
- At least one conversion event occurs (such as a form fill or purchase)
Engagement Rate is calculated as:
Engagement Rate = (Engaged Sessions / Total Sessions) × 100%
Example: If you have 5,000 total sessions and 3,000 are engaged, your Engagement Rate is (3,000 / 5,000) × 100 = 60%.
Key Components and Comparison Table
| Metric | GA4 Engagement Rate | GA4 Bounce Rate | UA (Legacy) Bounce Rate | Social Media Engagement Rate |
|---|---|---|---|---|
| What it Measures | Meaningful session interaction | % non-engaged sessions | % sessions with only 1 pageview | % likes, comments, shares, etc. |
| How It’s Calculated | % engaged sessions | 100% - Engagement Rate | % single-page, no interaction sessions | Based on social post interactions |
| Typical Benchmark | 52–62% (content sites/SaaS) | 38–48% | Varies | Varies (platform/content dependent) |
For more, see LovesData’s explanation.
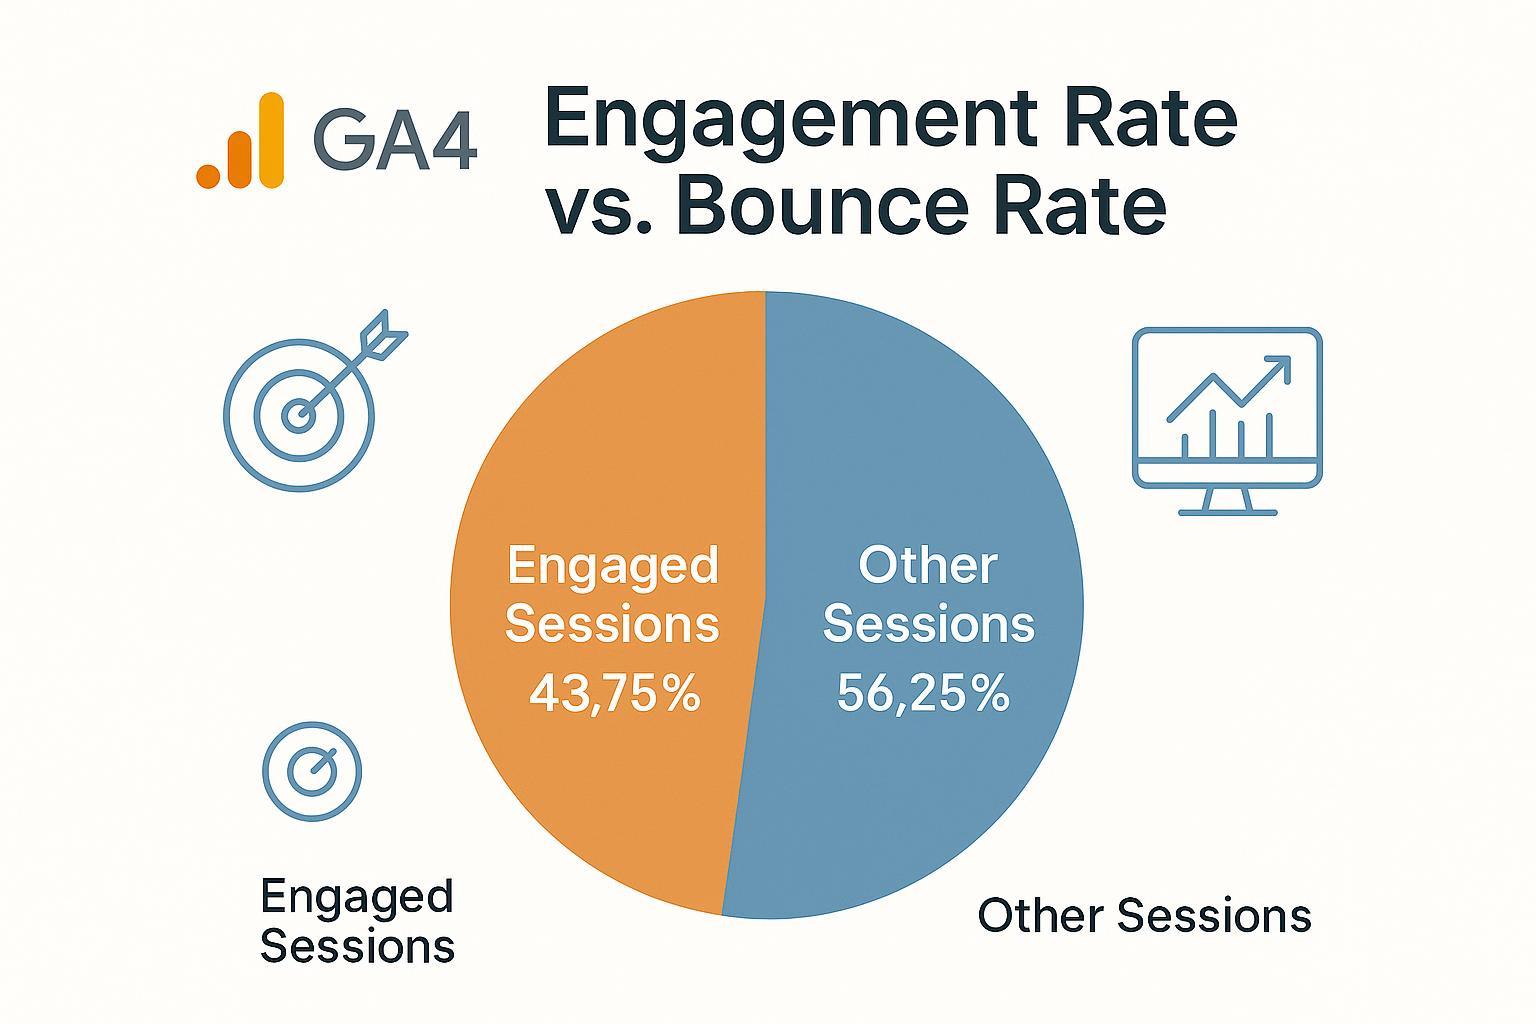
Key Difference: In GA4, Engagement Rate and Bounce Rate are mathematical opposites—if you have a 65% engagement rate, your bounce rate is 35%.
Practical Applications & Benchmarks
- Content Optimization: Use Engagement Rate after updating blog posts, adding internal links, or improving UX to see if user interaction increases.
- Industry Context: Benchmarks vary—B2B: ~63%, SaaS/Tech: ~53%, Travel: ~71% (source). Always compare against your own historical metrics and similar businesses.
- Advanced Tips: Segment your Engagement Rate by traffic source, device (mobile vs desktop), or landing page to uncover where your content performs best or needs work.
Scenario: After revamping a landing page by adding more visuals and a prominent call-to-action, a SaaS team saw Engagement Rate rise from 51% to 59%, directly tied to better conversions and lower churn.
Related Concepts
- Bounce Rate (GA4) – Now measures the percentage of non-engaged sessions (the opposite of Engagement Rate)
- Engaged Sessions – Sessions where at least one engagement criterion is met
- Session Duration – The length of time a session lasts
- Conversion Rate – The percentage of sessions resulting in desired actions
Common Confusions & Pro Tips
Engagement Rate in GA4 is not the same as social media engagement rate (which tracks interactions with posts). If you’re migrating from Universal Analytics, remember that the old bounce rate is now the inverse of Engagement Rate in GA4.
For best results, regularly track engagement trends after making site changes, segment your audience, and always pair Engagement Rate with other metrics like conversions and engagement time for well-rounded insights.
References: