Unlocking Content Performance: Key Metrics Every Marketer Should Track

Introduction
Struggling to prove the true value of your content efforts? You’re not alone. Many advanced marketers report difficulty connecting content performance with real business outcomes, especially amid a flood of vanity metrics and siloed dashboards. The difference between leaders and laggards in content marketing often boils down to tracking the right metrics—and knowing how to act on them.
This comprehensive guide will walk you through the proven, research-backed performance metrics that matter most in 2024 and beyond. You’ll discover how to define, track, and optimize each metric for maximum impact—moving your measurement strategy well beyond surface-level numbers to a model that reliably grows your influence, revenue, and retention.
1. Engagement Rate
What & Why: Engagement rate reflects how deeply users interact with your content—think scroll depth, average time on page, clicks, comments, and shares. It’s the canary in the coal mine for content relevance and quality.
How to Measure: Use platforms like Google Analytics, heatmapping tools like Hotjar, or BI platforms such as Databox for detailed metrics (scroll %, dwell time, interactions).
Benchmark: The median engagement rate across industries is 56.2%, with SaaS averaging 52.9% (Databox, 2023).
Actionable Improvement Tips:
- Audit high and low performing content to identify patterns.
- Use multimedia and strategic formatting to increase time on page.
- Add CTAs and interactive elements to drive deeper actions.
Impact: Higher engagement signals Google and social platforms that your content meets user needs, supporting SEO and distribution.
2. Conversion Rate
What & Why: Conversion rate is the percentage of users who complete a desired action (downloads, sign-ups, purchases) after consuming your content—your primary evidence of tangible ROI.
How to Measure: Set up clear goals and event tracking in Google Analytics or CRM platforms like HubSpot and Salesforce. Analyze by landing page, topic, funnel stage.
Benchmark: Median conversion rate across all industries is 2.01% (Databox, 2023).
Actionable Improvement Tips:
- Align CTAs tightly with content topics and reader intent.
- A/B test forms, headlines, and offer types regularly.
- Minimize friction on high-value conversion paths.
Impact: Direct, quantifiable proof of content effectiveness. For example, a mid-size e-commerce firm saw a 30% lift in conversions after segmenting content by buyer persona (Pipedrive case, via Swydo).
3. Content-Assisted Conversions
What & Why: Tracks the number and value of conversions influenced by content, even if content wasn’t the final conversion step. Avoids the single-touch attribution trap and gives content credit for moving buyers down the funnel.
How to Measure: Implement multi-touch attribution in Google Analytics, HubSpot, or Salesforce. Review conversion paths to assess all content touchpoints influencing leads.
Improvement Tips:
- Map key content to each funnel stage using frameworks like See-Think-Do-Care.
- Regularly review assisted conversion reports to optimize high-impact touchpoints.
Impact: Shows true content value and surfaces hidden ROI drivers, supporting smarter resource allocation.
4. Pipeline Velocity
What & Why: Measures the speed at which leads move through your pipeline after engaging with content. High velocity = shorter sales cycles and faster revenue realization.
How to Measure: Track average days from content touch (e.g., ebook download) to deal closure, using CRM platforms linked to your analytics stack.
Improvement Tips:
- Use nurturing sequences and retargeting to remove bottlenecks.
- Audit lagging content types and update with clearer value propositions.
Impact: Increased pipeline velocity is directly tied to improved cash flow and sales predictability.
5. Customer Retention & Cohort Analysis
What & Why: Understanding how well your content contributes to customer retention—and whether your audience stickiness is improving—is crucial for proving long-term impact.
How to Measure: Cohort analysis in Google Analytics or using custom reports in BI tools. Compare retention rates across audience segments exposed to different content types/frequencies.
Benchmarks: Industry retention rates vary by sector and model. Use Databox for latest medians and set your own cohorts as a baseline.
Improvement Tips:
- Personalize post-conversion content and knowledge base resources for new users.
- Track feature/content adoption over time to identify drop-off points.
Impact: Drives increases in Customer Lifetime Value (CLV) and advocacy, compounding your acquisition ROI.
6. Content-Attributed Revenue
What & Why: The ultimate business metric—total revenue tied directly (or via multi-touch) to content touchpoints. This is the CEO’s favorite number.
How to Measure: Use CRM attribution modeling (HubSpot, Salesforce, custom integrations) to tie closed deals or transactions back to content interactions. Formula: (Attributed revenue – content cost) / content cost for ROI.
Improvement Tips:
- Prioritize content that appears most often in high-revenue customer journeys.
- Test linking high-value assets deeper into sales enablement processes.
Impact: Clear evidence for budget increases and priority status for content marketing.
7. Lead Quality Score
What & Why: Not all leads are created equal. Lead quality scores aggregate demographic, behavioral, and engagement signals to flag best-fit prospects sourced via content.
How to Measure: Develop or adapt a scoring system in HubSpot, Salesforce, or BI dashboards, weighting factors most correlated with sales acceptance and conversion.
Improvement Tips:
- Refine your scorecard regularly in consultation with sales.
- Segment and nurture lower-scoring leads separately to recover pipeline leakage.
Impact: Ensures you’re not merely generating “leads,” but prospects likely to convert and stick.
8. Content Scoring & SEO Impact
What & Why: Content scoring models evaluate the holistic performance of assets across visibility, engagement, and influence. Integrate with SEO tools (Semrush, Ahrefs, Moz) for organic impact and competitor benchmarking.
How to Measure: Assign weighted scores for rankings, backlinks, referring domains, engagement rate, and assisted conversions.
Improvement Tips:
- Use these scores to audit your content library, identify gaps, and prioritize updates.
- Benchmark regularly against top competitors.
Impact: Enables data-driven editorial planning and maximum SERP share of voice.
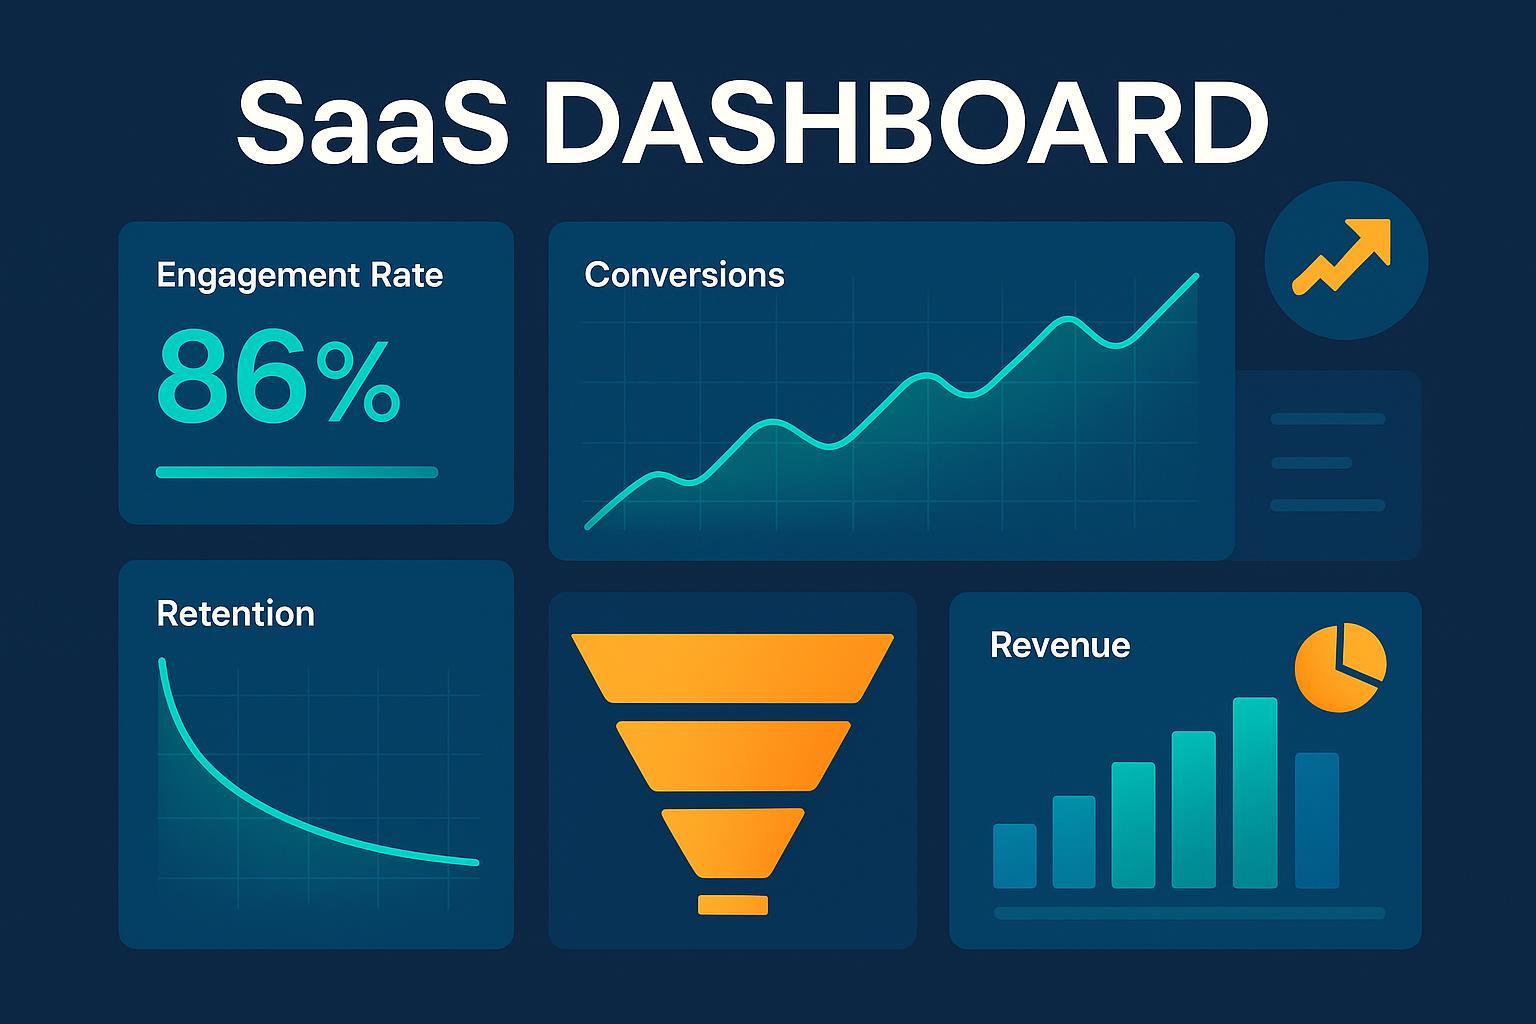
Visual Framework: Mapping Metrics to the Funnel
Top Funnel (Awareness): Engagement Rate, SEO Impact
Mid Funnel (Consideration): Lead Quality Score, Content-Assisted Conversions
Bottom Funnel (Purchase/Retention): Conversion Rate, Content-Attributed Revenue, Pipeline Velocity, Retention/Cohorts
Real-World Benchmarks & Resources
- Engagement Rate: Median 56.2% (Databox, 2023)
- Conversion Rate: Median 2.01%
- Retention: Varies by industry; use ongoing cohorts
- Playbooks/Guides: Swydo’s KPI Deep Dive, CMI Measurement Tactics
Conclusion: Metrics as Your Growth Lever
Tracking the right performance metrics is the foundation of an elite content marketing program. When you pair clear definitions with advanced measurement, actionable optimization, and robust benchmarking, you unlock real business impact—not just better reporting.
Ready to put these best practices into action? Start small: audit your current reports, pick one advanced metric to enhance, and map every insight to a business goal. The path to content-driven growth is a cycle of measurement, action, benchmarking, and improvement.
For further reading and templates:
- Content Marketing Institute: Research Hub
- Databox Marketing Benchmarks
- Analytify Content Marketing Metrics
Content benchmarks and research cited from CMI, Databox, Swydo, and published industry case studies as of 2023–2024.