A/B Test Results Report Checklist and Template (United States)

Whether you’re a Growth/CRO manager or a product analyst, this US-adapted checklist and copyable template will help you produce repeatable, decision-ready A/B test reports. It emphasizes statistical rigor, segmentation, and U.S. privacy/accessibility notes, while keeping the language approachable for stakeholders.
How to use this checklist
- Work through the sections in order for each experiment.
- Copy the template at the end and fill it out using American date formats (MM/DD/YYYY) and time zones (ET/PT).
- Keep external links minimal but authoritative to reinforce methods and compliance.
1) Setup & Pre-Results Validation
-
Confirm the experiment overview is complete: name, owner, variants (A control, B/C challengers), audience, traffic split, platforms/URLs, planned duration.
- Why this matters: Clear context prevents misinterpretation and speeds reviews. See the structured elements widely used in templates such as the VWO A/B testing template.
-
State a clear hypothesis tied to behavior or business outcome, including rationale from research or prior tests.
- Example: “Emphasizing free returns in checkout copy will increase conversion rate by at least 3%.” Nielsen Norman Group offers foundational guidance in A/B Testing 101 (evergreen).
-
Define your metrics taxonomy: Primary KPI(s), Secondary metrics, and Guardrail metrics (e.g., page load, crash/error rates, support tickets).
- Microsoft’s experimentation guides detail trustworthy setup patterns in the Pre-Experiment Patterns (Microsoft Research, ongoing series).
-
Choose and document your statistical framework: frequentist (p-values, fixed alpha) or Bayesian (posterior probabilities, credible intervals). Declare peeking/monitoring rules.
- For an accessible comparison of frameworks, see the 2023 discussion in Amplitude’s frequentist vs Bayesian overview.
-
Pre-register MDE, power, alpha, and sample size. Record assumptions and the calculator/tool used.
- Common practice is power ≥80% and alpha = 0.05. For practical guidance, review the primer in the Omniconvert power analysis explainer and perspectives in Statsig’s power in A/B testing.
-
Set stopping rules: fixed-horizon vs sequential testing. Avoid unplanned peeking if using frequentist fixed-horizon.
- Engineering teams such as Netflix and Spotify describe sequential monitoring tradeoffs in the Netflix Tech Blog on sequential A/B testing (2023) and the Spotify engineering comparison (2023).
-
Prepare SRM (Sample Ratio Mismatch) checks and randomization validation.
- SRM detection is a cornerstone of data quality. Microsoft Research’s guide to diagnosing SRM in A/B testing explains expected vs observed allocation issues.
-
Add U.S. compliance and accessibility reminders to your report preface.
- Summarize cookie consent impacts and CCPA/CPRA alignment; cite current regulation materials such as the California Privacy Protection Agency regulations PDF. If the UI changes could affect assistive tech users, note ADA/WCAG checks using the DOJ’s ADA.gov web guidance and the W3C’s WCAG overview.
2) Results Summary & Interpretation
-
Present core outcomes for the Primary KPI: absolute values and relative lift per variant, with uncertainty.
- Show 95% confidence intervals (frequentist) or credible intervals (Bayesian) for both the KPI and the difference/uplift. For accessible interval explanations, see the CXL confidence intervals guide and the Amplitude confidence interval explainer.
-
Clearly declare the statistical evidence according to your framework.
- Frequentist: report the p-value and alpha threshold; avoid over-interpreting “just significant” results.
- Bayesian: report the posterior probability of being best and the credible interval; include expected loss if available. For a practical Bayesian overview, see AB Tasty’s Bayesian A/B testing article.
-
Interpret practical significance and business impact.
- Translate lift into business-relevant terms (e.g., expected weekly revenue change). Stakeholders need both statistical and practical significance.
-
Summarize guardrail outcomes and any notable secondary metrics.
- Guardrails protect user experience and reliability; Microsoft’s “during experiment” patterns emphasize tracking stability in the During-Experiment Patterns.
-
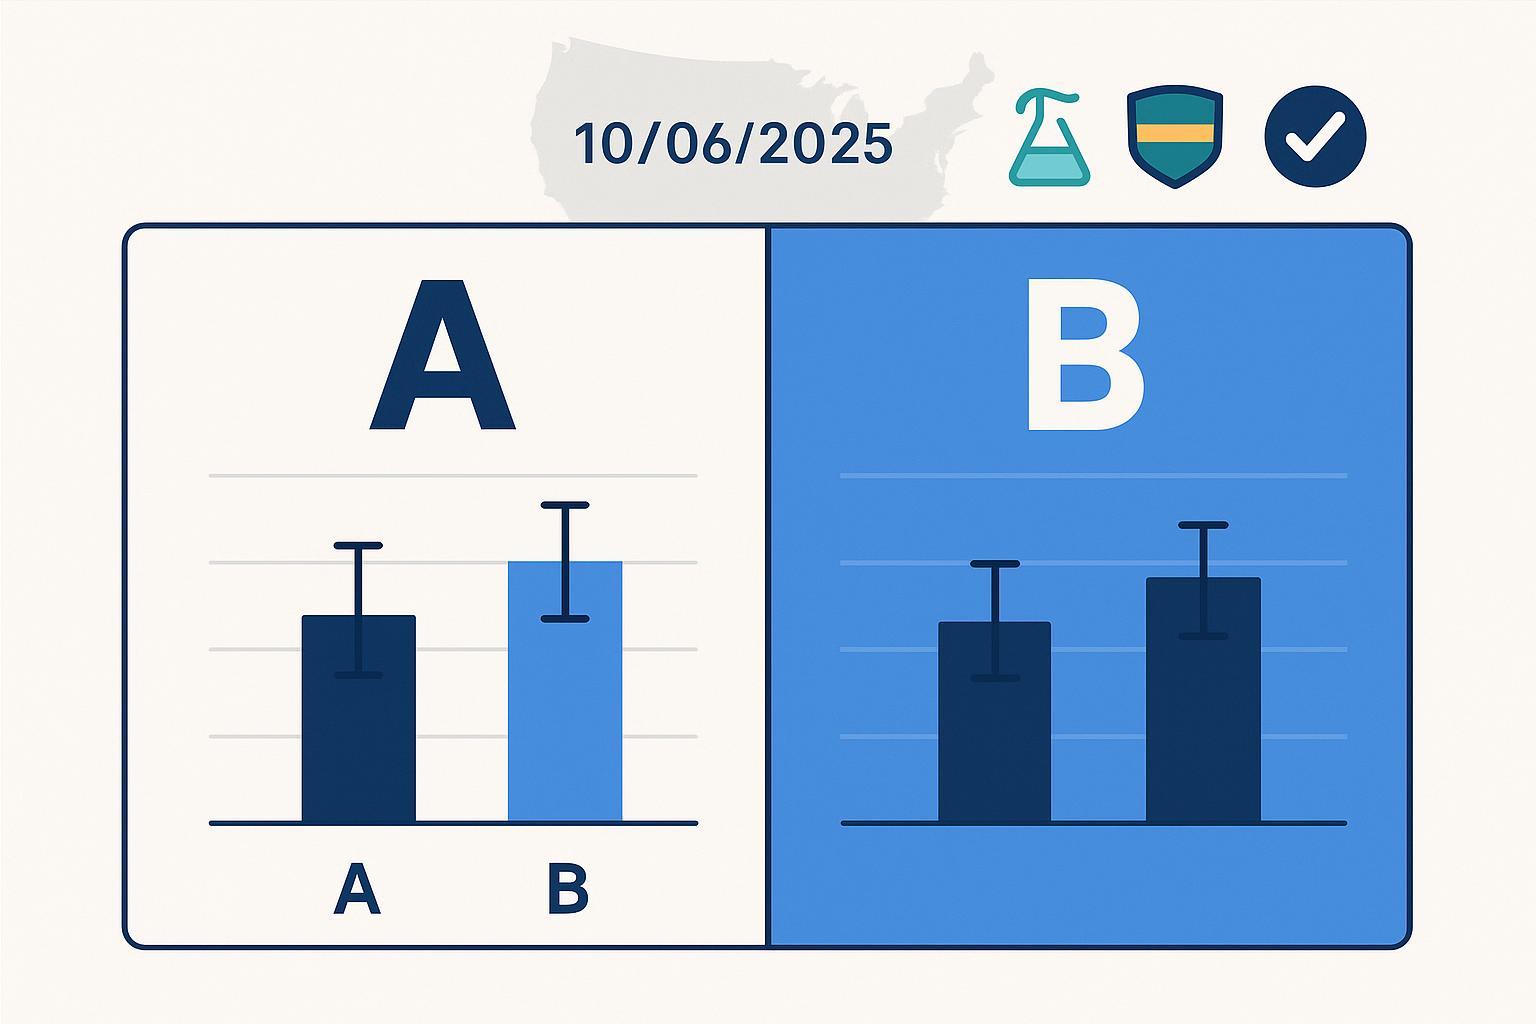
Visualize results with clarity and uncertainty.
- Use bar/line charts with error bars (95% CI or credible interval), annotate N per variant, allocation, and run dates. Uplift tables with interval bounds aid decision-making.
3) Diagnostics & Segmentation
-
Report SRM results explicitly: expected vs observed allocation and SRM p-value. If SRM is detected, pause interpretation and investigate.
-
Provide segment splits with Ns and intervals for each: device (mobile/desktop/tablet), user type (new vs returning), geography (U.S.-only vs international; state/region if relevant), and traffic source.
- Segment heterogeneity often explains mixed outcomes. Incorporate interval visuals. For interpreting intervals across segments, review the Amplitude CI explainer.
-
Check novelty/fatigue and weekday/weekend patterns; note bot filtering and instrumentation changes.
- For a comprehensive data quality perspective, Microsoft’s article on data quality fundamentals for trustworthy A/B analysis is a useful reference.
-
Disclose variance reduction if used (e.g., CUPED): covariates, adjustment method, and adjusted vs unadjusted results.
- CUPED can materially improve sensitivity; see Microsoft’s deep dive on variance reduction.
-
Document multiple comparisons handling when testing many variants/metrics/segments.
- Methods like Bonferroni/Holm (FWER) or Benjamini-Hochberg (FDR) should be noted. For approachable explanations, consult the Amplitude Bonferroni correction explainer and Statsig’s overview on controlling Type I errors.
-
Note overlapping experiments and exposure interactions; record risk tolerance and mitigations.
4) Decision & Next Steps
-
Declare outcome: winner, loser, or inconclusive.
- If inconclusive, document whether insufficient power or low practical significance drove the decision.
-
Define rollout scope and timing.
- Include gating criteria (e.g., no guardrail regressions beyond thresholds), phase rollout plan, and monitoring windows.
-
Record risk assessment and rollback plan.
- Specify who monitors post-rollout metrics, how alerts trigger rollback, and what thresholds apply.
-
Capture learnings and external validity limits.
- Example: “Effect concentrated on mobile traffic in the U.S. Midwest; limited applicability to international users.”
-
List follow-up experiments and analysis tasks.
- Examples: refine copy for desktop, run geo-specific personalization test, validate device-specific effects.
5) Troubleshooting & Common Pitfalls (Quick Checks)
-
Avoid peeking in fixed-horizon frequentist tests; if interim monitoring is required, use a sequential framework.
- Engineering discussions on monitoring boundaries appear in both the Netflix Tech Blog’s sequential A/B post and the Spotify engineering comparison (2023).
-
Watch for insufficient sample size or low power.
- If MDE/power aren’t met, treat results cautiously; consider extending duration or increasing exposure.
-
Account for multiple comparisons inflation when analyzing many variants or segments.
- Apply and report a correction method (FWER or FDR) to keep false positives in check.
-
Validate instrumentation changes and bot filtering.
- Logging alterations during the test can bias results; document any changes that occurred.
-
Check collisions or overlapping experiments that could interact with your treatment.
6) Copyable US-Formatted A/B Test Results Report Template
Paste this into your doc or sheet and fill it in. Use American date formats (MM/DD/YYYY) and specify timezone (ET/PT).
Report Header
- Experiment name:
- Owner:
- Platform/URLs:
- Audience:
- Allocation (e.g., 50/50):
- Planned run: Start MM/DD/YYYY (ET/PT) → End MM/DD/YYYY (ET/PT)
- Hypothesis:
- Statistical framework: Frequentist (α= ) or Bayesian (priors: )
- Pre-registered: MDE= ; Power= ; α= ; Required n/arm= ; Tool used:
- Stopping rules: Fixed-horizon or Sequential (boundaries: )
- Compliance & accessibility notes: CCPA/CPRA consent handling; ADA/WCAG check if UI impacted
Design & Data Quality
- Variants and changes documented (A control, B/C challengers)
- Randomization integrity verified
- SRM readiness noted (method/tool)
- Overlapping experiments exposure documented
Results Summary (Primary KPI)
- Variant A: value, 95% CI or credible interval, N
- Variant B: value, 95% CI or credible interval, N
- Absolute difference (B − A): value, interval
- Relative lift: % lift, interval
- Frequentist: p-value vs α= ; Bayesian: posterior probability of being best; expected loss
Secondary & Guardrails
- Secondary metrics: values + intervals
- Guardrails (e.g., performance, errors, support): status vs thresholds
Visualization Notes
- Chart types used: bar/line with error bars
- Annotations: N, allocation, dates, segment labels
Diagnostics & Segmentation
- SRM results: expected vs observed; p-value
- Device: mobile/desktop/tablet — values + intervals + N
- User type: new vs returning — values + intervals + N
- Geography: U.S.-only vs international; state/region if relevant — values + intervals + N
- Source: key traffic sources — values + intervals + N
- Novelty/fatigue, weekday/weekend patterns
- Variance reduction: CUPED used? Covariates: ; Adjusted vs unadjusted shown
- Multiple comparisons: correction method and family defined
Decision & Next Steps
- Outcome: winner/loser/inconclusive
- Rollout plan: scope, phases, monitoring window
- Risks & rollback thresholds: owner and alerting
- Learnings:
- External validity limits:
- Follow-up experiments:
Footer — Compliance & Accessibility (United States)
- CCPA/CPRA consent handling summarized; internal policy link if applicable
- ADA/WCAG conformance noted (e.g., WCAG 2.1 AA checks if UI changed)
- Retrieval date for regulation references: MM/DD/YYYY
Practical Tips for Stakeholder Readability
- Lead with the decision and the “so what.” Place the outcome and impact at the top of your executive summary.
- Show both absolute and relative effects. Executives often prefer percent lift, but absolute changes help calibrate scale.
- Keep uncertainty visible. Confidence or credible intervals build trust and prevent overclaiming.
- Avoid dense statistical jargon in the main narrative; keep technical detail in the appendix or tooltips.
References and Further Reading
- Microsoft Research’s trustworthy experimentation series: Pre-Experiment Patterns, During-Experiment Patterns, and variance reduction deep dive.
- Confidence intervals for experimentation: CXL guide and Amplitude explainer.
- Sequential testing context: Netflix Tech Blog overview and Spotify engineering comparison.
- Power/MDE basics: Omniconvert explainer and Statsig perspectives.
- U.S. compliance and accessibility: CPPA regulations PDF, ADA.gov web guidance, and W3C WCAG overview.