Designing an Effective A/B Test Plan for the U.S. Pricing Page: Hypothesis, Variant, Metric, Guardrails, Sample Size

If you handle pricing in a U.S.-based SaaS or e‑commerce business, you already know: pricing tests carry higher risk and higher reward than typical headline or CTA experiments. The best plans combine rigorous hypotheses, clean instrumentation from “price rendered” to “price charged,” explicit guardrails, and a defensible statistical design. What follows is a practitioner-first playbook I use in 2025—tuned for U.S. legal realities like California’s price-transparency rules and the FTC’s evolving guidance on fees—to run pricing page A/B tests that your finance, legal, and support teams will stand behind.
The end-to-end workflow (you can copy this into your playbook)
- Business alignment and risk review
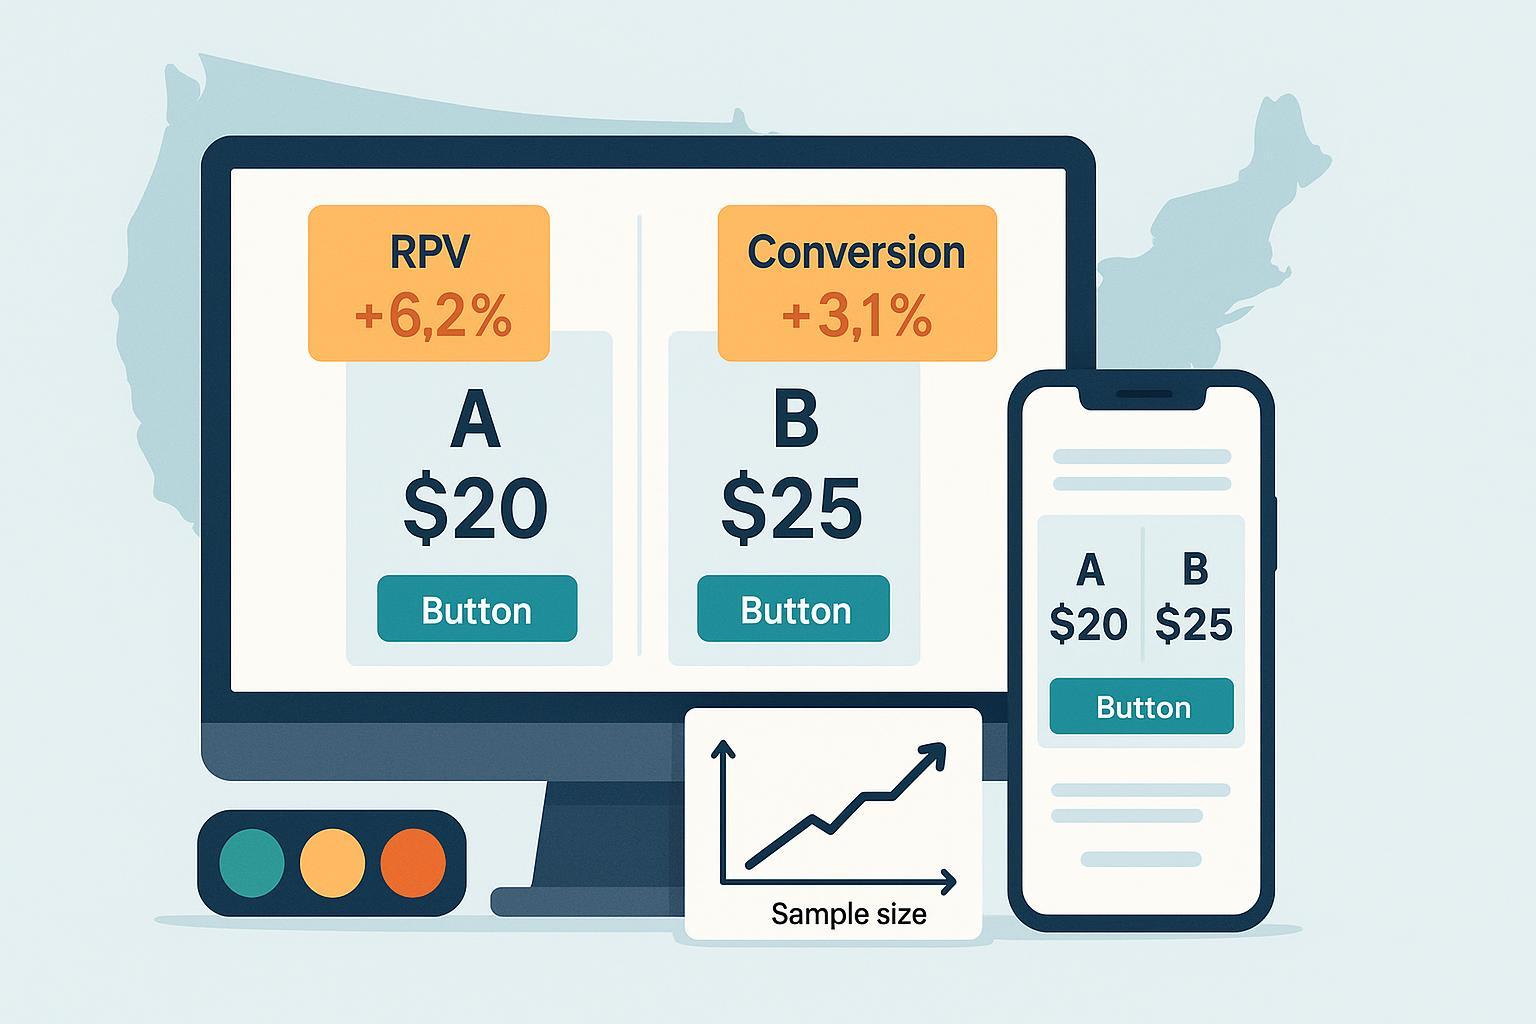
- Define the outcome: e.g., “Lift revenue per visitor (RPV) by 3–5% without exceeding a 0.5–1.0% absolute drop in checkout conversion.”
- Map owners: product, growth/CRO, analytics, finance, support, legal/compliance.
- Confirm scope: U.S. visitors only, or U.S. plus selected regions? Call out California explicitly for transparency compliance.
- Hypothesis and variant design
- Write a falsifiable hypothesis: “Changing X for Y audience will move Z metric by M because [behavioral rationale].”
- Change one major price lever per cycle (price point, packaging, discount framing, fee disclosure) unless you’re powered for factorial designs.
- Pre-register success criteria, MDE, and test duration before you build.
- Instrumentation and QA
- For any price logic or checkout-affecting change, use server-side assignment; avoid UI-only price manipulation for production revenue.
- Emit joinable events for both “price_rendered” and “price_charged,” with experiment/variant IDs and fee breakdowns.
- Validate parity (what users see equals what they pay), bot filtering, and session integrity before launch.
- Sample size, allocation, and duration
- Compute sample size off your baseline and MDE with power 80–90% and alpha 0.05.
- Default to even splits; consider stratified randomization by device, channel, or state to reduce variance.
- Fix a maximum run length (often 2–8 weeks) and define whether you’ll use fixed-horizon frequentist, sequential, or Bayesian monitoring.
- Guardrails and stop/reject criteria
- Establish customer and revenue guardrails: checkout conversion floor, refund/chargeback thresholds, support ticket spikes, and NPS/CSAT dips.
- Predefine stop-loss and proceed criteria to avoid “moving goalposts.”
- Launch and live monitoring
- Soft-launch during business hours with on-call owners and rollback steps.
- Monitor traffic splits, event loss, metric sanity checks, and guardrail dashboards in real time.
- Analyze per plan
- Use variance reduction (e.g., CUPED) when appropriate; bootstrap revenue metrics due to skew.
- Segment for heterogeneity carefully; avoid p-hacking.
- Decide and roll out
- Ship, iterate, or reject based on pre-registered thresholds and financial model impact (MRR/GPV).
- Plan phased rollouts (20% → 50% → 100%) and continue guardrail monitoring.
- Communicate and document
- Send succinct weekly updates to stakeholders; equip support with macros for pricing inquiries.
- Log learnings and update your internal playbook.
For foundational concepts and a deeper workflow walkthrough, see the pricing experimentation process explained in the Monetizely team’s guide on the pricing experimentation workflow and measurement framework (2025).
Craft sharper pricing hypotheses (with real examples)
Strong pricing tests tie directly to willingness-to-pay or value perception. Examples I’ve seen work in practice:
- Price point (SaaS monthly): “Raising Pro from $39 → $45 for new U.S. self-serve visitors will increase RPV by ≥3% with no more than a 0.5% absolute drop in checkout conversion because the new AI capability increases perceived value.”
- Packaging: “Moving Feature X from Basic to Pro will nudge 5–8% of Basic intenders to Pro, lifting ARPU by ≥4% without increasing 60-day churn.”
- Discount framing: “Framing the annual plan as ‘2 months free’ vs. ‘Save 16.7%’ increases annual take-rate by 10–15% due to simpler mental math.”
- Upfront fee transparency (California): “Including mandatory service fees in the upfront price reduces checkout abandonment by ≥1% in California traffic due to clearer expectations.”
For an approachable primer on pricing-specific hypotheses and trade-offs, the Statsig team’s 2025 write-up on A/B testing for pricing best practices outlines common levers and pitfalls.
Metric framework: primary, secondary, and guardrails
Pick one primary metric and commit to it before launch:
- Primary: RPV/RPS, conversion to paid from the pricing page, or ARPA/ARPU (for trials-to-paid funnels).
- Secondary: plan mix (monthly vs. annual), AOV or ACV, discount utilization, upsell/cross-sell.
- Lifecycle reads: early churn/cancel inside 30–60 days, refunds/chargebacks, retention at 30/60/90 days, updated CAC-to-LTV ratios.
Guardrails that protect the business (tune to your context):
- Checkout conversion: absolute drop tolerance ≤0.5–1.0 percentage points.
- Support load: “pricing”-tagged tickets ≤ +10% vs. control.
- Payments risk: refund/chargeback rates not exceeding baseline by >20% relative.
- Transparency: for California visitors, verify no “drip pricing” patterns.
The Monetizely workflow article’s measurement framework and phases (2025) gives a structured way to define primary vs. guardrail metrics before you start building.
Statistical design that earns stakeholder trust
Minimum Detectable Effect (MDE)
- MDE is the smallest true effect you want enough power to detect. Lower MDEs lengthen tests; higher MDEs shorten tests but risk missing smaller wins. A concise overview of how MDE shapes your timeline and decisions is covered in AB Tasty’s 2025 guide on MDE as the essential ally in A/B tests.
Sample size: quick back-of-napkin
- Suppose baseline checkout conversion is 4.0%. You want a +0.4 pp lift (10% relative), α=0.05, power=0.8. A simple two-proportion formula puts you roughly in the 19k–23k sessions per arm range, depending on variance assumptions and continuity corrections. Validate with your platform’s calculator.
Proportions (conversion) sample size approximation:
n_per_arm ≈ [ (Z_(1-α/2) + Z_(1-β))^2 × (p(1−p) + p(1−p)) ] / (p1−p2)^2
Revenue metrics are heavy-tailed
- RPV is skewed and zero-inflated. Use bootstrap confidence intervals and consider two-part models if you have the stats resources. NN/g’s fundamentals piece on A/B testing basics (2024) is a helpful refresher on power, peeking risk, and analysis discipline.
Variance reduction
- Variance reduction methods like CUPED can materially shorten tests when you have pre-period covariates correlated with outcomes. The Statsig team’s 2025 explainer on CUPED and reducing variance in experiments and Spotify’s Confidence docs on variance reduction techniques (2025) outline when and how to apply them.
Frequentist vs. Bayesian vs. sequential
- Fixed-horizon frequentist designs are simple and familiar; just avoid peeking without corrections.
- Bayesian approaches give intuitive “probability of superiority” and support principled early stopping with well-chosen priors.
- Sequential monitoring (alpha spending) is a middle ground; if you use it, lean on your platform’s built-in implementations. AB Tasty and Analytics Toolkit discuss MDE trade-offs and peeking pitfalls in their 2024–2025 resources, e.g., the Analytics Toolkit note on when observed effects fall below the MDE (2024).
Guardrails and stop/reject rules (numeric templates)
Pre-register rules to reduce bias and internal debate:
- Stop-loss: if Bayesian posterior probability of harm to checkout conversion > 90% for 24 consecutive hours, pause and review. In frequentist setups, set an interim checkpoint: if the absolute drop ≥1.5 pp with p<0.01, stop.
- Proceed: ship if the primary metric meets or exceeds the MDE at your confidence threshold (e.g., posterior Pr(RPV > 0) ≥ 95% or p<0.05) and all guardrails remain within bounds.
- Soft roll-out: when the primary metric is ≥ 0 and guardrails are green, use a phased exposure (20% → 50% → 100%) and continue monitoring.
Financial guardrails
- Model monthly revenue impact by blending conversion and ARPU movement (i.e., RPV). Require a minimum projected uplift (e.g., +$N per month with sensitivity analysis) to account for variance and regression to the mean.
Implementation and QA when the test touches checkout
Server-side and data integrity
- If price, tax, fee, or discount logic is involved, run server-side assignment and enforcement. UI-only price changes can desynchronize “price shown” and “price charged,” creating risk and contaminating data.
- Reconcile payment events with experiment logs daily. The Stripe engineering team’s 2024 article on how they built payment-method A/B testing shows practical patterns: idempotency keys, webhook signature validation, and experiment metadata that survives payment flows.
Event instrumentation
- Emit “price_rendered” with variant and offer ID; emit “price_charged” with net amount, taxes/fees, and transaction ID. Join on session/user and experiment IDs in your warehouse.
- Alert on mismatches between rendered and charged amounts and on data loss in either stream.
- Run an A/A test to validate assignment, joinability, and sanity of metrics.
- Smoke-test top devices/browsers and payment methods.
- Validate transparency rules for California routing and any industries covered by federal rules (see next section).
For a phased, tooling-oriented view of setup and rollout, see this practical overview of pricing experimentation phases and tooling (Monetizely, 2025).
Variant creation and tool integration (with a neutral product example)
In pricing experiments, the “tool” is less about fancy UI and more about reliable assignment and measurement:
- Prefer full-stack/server-side experiment frameworks for any test that affects offer logic, cart totals, or eligibility.
- Ensure your experimentation platform can attach experiment metadata to downstream payment and CRM events.
- Build a simple offer registry: stable IDs for each price/plan/discount combination so analysis doesn’t rely on brittle string parsing.
Example setup workflow
- Define variants in code with explicit offer IDs and fee logic.
- Use feature flags for safe rollouts and instant kill switches.
- Pipe assignment and price events to your analytics/warehouse with consistent schemas.
If you need a cross-functional hub for scoping, documenting hypotheses, and mapping metrics to phases, tools like Monetizely can help teams align on objectives, variants, and guardrails while your engineering stack handles the server-side enforcement. Keep this layer descriptive and process-oriented—leave the actual price calculation and assignment to your application and experimentation infrastructure.
U.S. legal and ethical guardrails you must plan around
- FTC Junk Fee Rule (16 CFR Part 464). Effective May 12, 2025, the rule requires upfront total price disclosure—including mandatory fees—in specific sectors (notably live-event ticketing and short-term lodging). See the FTC’s official Federal Register final rule PDF and the companion FTC FAQs on the rule (2025) for scope and examples.
- California SB 478 (effective July 1, 2024). California’s transparency statute broadly bans “drip pricing” by requiring that mandatory fees be included in the advertised price for goods/services sold to Californians. Read the official California SB 478 bill text.
- Personalized pricing and privacy. The FTC’s 2025 surveillance-pricing study signals heightened scrutiny on individualized prices informed by personal data; if you test personalized offers, align with privacy-by-design, clear disclosures, and consent where needed.
Practical checklist
- Include mandatory fees in upfront prices for California traffic; avoid separate mandatory add-ons late in the funnel.
- If you operate in sectors covered by the federal rule, ensure total-price display and fee representations meet the FTC’s examples.
- Keep language truthful and consistent across banners, footers, and checkout.
- Document data sources and consent if experimenting with personalized prices.
Monitoring, analysis, and decisioning
Daily during the run
- Check exposure splits, assignment integrity, event volumes, and guardrails.
- Triage anomalies quickly: data pipeline delays, payment outages, or rogue bot traffic can mimic “effects.”
At decision time
- Primary metric: has it met or exceeded the MDE at your pre-chosen confidence threshold?
- Guardrails: are conversion, refunds, disputes, and support load within your bounds?
- Finance lens: does the projected monthly uplift, net of costs and uncertainty, pass your hurdle?
Document the decision with 3–5 bullets and a single chart that shows the primary metric trajectory and confidence interval/posterior over time.
Troubleshooting playbook (what derails pricing tests and how to respond)
- Novelty effects: Early spikes or dips commonly fade. Require a minimum run beyond initial novelty before concluding. NN/g’s 2024 overview on A/B run discipline in the A/B testing basics guide is a good reminder to avoid reacting to noisy early signals.
- Sample bias or traffic imbalance: Audit randomization and consider stratified assignment (device, channel, state). If imbalance persists, annotate and reweight cautiously; better yet, rerun.
- Low traffic: Increase MDE expectations, test higher-signal levers (e.g., annual framing), or use variance reduction methods; sequential/Bayesian approaches can help with principled early stopping.
- Multiple changes at once: Decompose the price change into a series of tests unless you have the traffic and plan for factorial analysis.
- Support escalations: Prepare macros for “pricing changed” inquiries and escalate patterns to product/legal. A simple message like, “We’re piloting clearer total pricing to help customers avoid surprises—thanks for the feedback,” defuses surprises and signals transparency.
- Data quality drifts: Monitor join rates between “price_rendered” and “price_charged,” error logs, and payment reconciliation alerts. Pause if integrity is compromised; decisions made on bad data create bigger downstream costs.
Rollout, comms, and documentation that stick
- Phased rollouts: Move from 20% → 50% → 100% when the primary metric is neutral or better and guardrails are green.
- Internal comms: A single-page memo with the hypothesis, MDE, run dates, primary result, and a screenshot of the main graph will answer 90% of stakeholder questions.
- Customer-facing copy: For material changes, update FAQs and plan pages; emphasize transparency and value. If California pricing presentation differs, explain why succinctly.
- Postmortem: Save charts, queries, experiment IDs, and a 10-bullet learning summary in your experimentation repo. Reuse good scaffolding and retire patterns that caused confusion.
For a zoomed-out look at how teams operationalize all of this, the Statsig team’s perspective piece on pricing A/B testing in 2025 is useful context alongside your internal standards.
Worked example: from hypothesis to decision
- Hypothesis: “Framing annual as ‘2 months free’ vs. ‘Save 16.7%’ will increase annual take-rate by 12% (target MDE 8–12%) without >0.5 pp absolute decrease in checkout conversion.”
- Metrics: Primary = annual take-rate; Secondary = RPV; Guardrails = conversion, refunds, support tickets.
- Stats approach: Bayesian with sequential monitoring; CUPED using prior 28-day spend as covariate.
- Sample size: Based on baseline annual take-rate and target MDE, estimate 3–4 weeks at your traffic to achieve ≥0.8 power (validate in your platform calculator).
- Stop rules: Pause if Pr(harm to conversion) > 90% for 24h.
- Decision: After 21 days, posterior probability that annual take-rate improved is 97%; RPV is +2.1% with 94% probability; guardrails within bounds. Proceed with a 20% → 50% → 100% rollout, continue monitoring for 2 weeks, then close the experiment.
Quick reference: do’s and don’ts that consistently save teams from pain
Do
- Pre-register MDE, metrics hierarchy, and stop rules.
- Use server-side enforcement for any price/checkout logic.
- Track both “rendered” and “charged” price events and reconcile with payments daily.
- Design guardrails that reflect true business risk (conversion floors, disputes, support load, transparency checks).
- Consider variance reduction and bootstrap for skewed revenue outcomes.
Don’t
- Don’t change multiple major levers simultaneously unless powered for factorial analysis.
- Don’t peek and pivot analysis midstream; decide your statistical approach before launch.
- Don’t rely on UI-only price changes that your backend can’t enforce.
- Don’t ignore U.S. transparency rules—especially for California traffic and any sectors covered by the FTC’s total-price requirements.
Further learning (for teams building durable pricing experimentation programs)
- A structured, end-to-end overview of pricing experimentation—hypotheses, tooling, and measurement—can be found in this concise pricing experimentation guide (Monetizely, 2025).
- If you’re evaluating vendors or building a toolchain, this overview of pricing experimentation phases and tooling (Monetizely, 2025) maps responsibilities across functions.
- For advanced metric and segmentation thinking, pair your internal docs with a technical primer like Statsig’s marketplace experiments guide on advanced metric design and variance reduction (Spotify Confidence, 2025) and the 2025 CUPED explainer from Statsig cited above.
References called out inline
- Transparency and fees: FTC final rule (2025 effective date) and FAQs; California SB 478 bill text.
- Experimentation craft: NN/g A/B fundamentals (2024), Statsig CUPED explainer (2025), Spotify Confidence variance reduction (2025), AB Tasty on MDE (2025), Analytics Toolkit on MDE pitfalls (2024), Stripe engineering on payment experiment integrity (2024).