Measuring Customer Experience ROI with AI Analytics


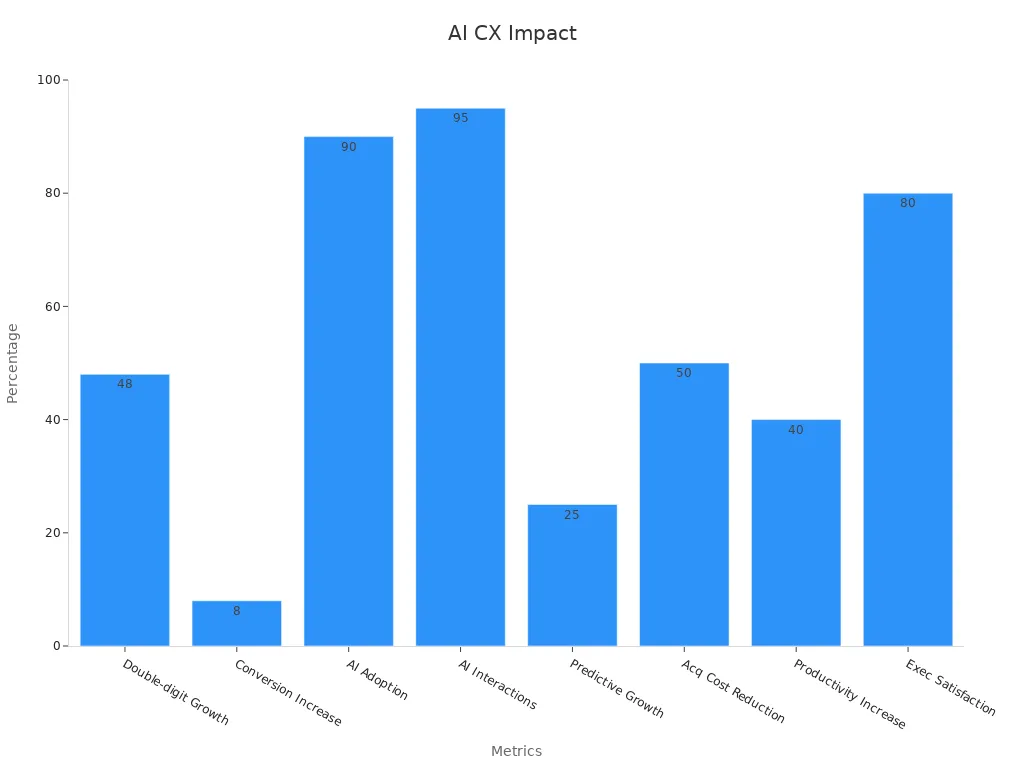
AI analytics helps companies measure Customer Experience ROI very well. It tracks how much money is saved and how much more is earned. Leaders can see how AI projects help the business. Companies that focus on customer experience get real results. They can grow revenue by up to 25%. They can also cut acquisition costs by 50%. Setting starting points and using data helps keep improving.
Leaders who use AI analytics get helpful information. This lets them make faster choices and get better results.
Key Takeaways
AI analytics helps companies see how much money they save and make. This helps them make more money and spend less.
Measuring Customer Experience ROI shows how happy customers help profits grow. Happy customers come back and stay loyal. It costs less to keep customers than to get new ones.
Setting clear CX goals that match business goals helps teams work together. This helps everyone focus on what is most important for success.
AI-powered tools give quick insights and make customer talks personal. These tools also do tasks automatically. This makes customers happier and saves money.
Watching results all the time and showing data in pictures builds trust. Sharing results helps companies keep getting better at customer experience and grow their business.
Why Measure Customer Experience ROI
Business Impact
Measuring Customer Experience ROI helps companies see how their actions help the business. Companies that spend money on Customer Experience often make more money and keep customers longer. The XM Institute found that customers who think a company’s Customer Experience is “very good” are much more likely to:
Tell friends about the company (88% vs. 15%)
Buy again (87% vs. 18%)
Trust the company (81% vs. 15%)
Forgive mistakes (67% vs. 15%)
Try new things (58% vs. 13%)
If a company keeps just 5% more customers, profits can go up by 25% to 95%. This shows how important it is to keep customers happy. Also, 86% of people say they will pay more for a better experience. It is cheaper to keep customers than to get new ones. Getting a new customer can cost six times more than keeping one.
IKEA’s work on omnichannel Customer Experience helped it make over $40 billion each year. This shows that spending on Customer Experience can help a business grow.
Companies that measure Customer Experience ROI can see what works and fix what does not. They can make better choices and avoid losing money from bad Customer Experience. PwC says one out of three customers will leave after just one bad experience. Most will not come back after two or three bad times.
Common Challenges
Using AI analytics to measure Customer Experience brings some problems:
Companies need to spend a lot and change their systems.
The personalization-privacy paradox is hard. AI can make things personal, but people worry about privacy and may not share data.
There is a lot of competition, so even with AI, customers may still leave.
Teams must find the most important customer journeys and problems before making changes.
Success needs teams to work together—data scientists, business managers, and experts must all help to understand and act on customer behavior.
AI-powered systems must keep checking and getting feedback to make the customer journey better.
Companies need plans to balance privacy and personalization and use AI-driven journey mapping to stop customers from leaving.
These problems need good planning and hard work. Companies that solve them can get the most out of AI analytics for Customer Experience.
Customer Experience ROI Defined
Key Metrics
Customer Experience ROI shows how customer actions help a business. Companies watch how customer interactions change revenue, loyalty, and efficiency. Research says connecting customer experience metrics across teams helps results. For example, CX teams that check how customer satisfaction affects business are 29% more likely to get more budget, says Gartner. Forrester’s 2022 survey found companies with strong CX alignment grow revenue 2.4 times faster and double their profit growth.
Each department tracks different key metrics:
Support: average resolution time, first response time, customer effort score
Product: product adoption rates, customer retention rates
Sales: frequency of purchase, average order size
Marketing: CSAT (Customer Satisfaction Score), NPS (Net Promoter Score), social media sentiment
Finance: customer lifetime value, churn rate
Companies use data and models to follow these metrics. The table below lists common metrics, how to figure them out, and where to get the data:
Metric Name | Calculation Method | Data Source |
|---|---|---|
Customer Satisfaction (CSAT) | Survey-based scoring | Customer surveys |
Net Promoter Score (NPS) | % Promoters - % Detractors | Feedback widgets |
Customer Effort Score (CES) | Average score from effort scale | Customer surveys |
Repeat Customer Rate (RCR) | (Repeat customers / Total customers) x 100 | Ecommerce platform |
Customer Retention Rate (CRR) | [(Customers at end - New customers) / Customers at start] x 100 | Analytics tools like Mixpanel |
Companies that share data and insights across teams can link CX improvements to real business results.
Financial and Experiential Value
Customer Experience ROI gives value in two ways: money gains and happier customers. Companies get more revenue, keep more customers, and spend less. Customers feel happier and stay loyal. Studies show people feel more joy from experiences than from things. For example, buying experiences makes people less sorry and more satisfied because it helps their lifestyle.
Healthcare studies show that managing expectations and talking about benefits, like not needing glasses after surgery, can lower regret and make people happier. This link between money choices and customer happiness shows why both matter. Companies that care about both financial and experiential value build stronger relationships and grow for a long time.
Setting CX Goals
Aligning with Business Outcomes
Companies do best when they link CX goals to business goals. Leaders first pick what is most important. This could be making more money, keeping customers, or lowering costs. Next, they match CX goals to these business needs. This way, all teams work toward the same things.
When leaders help and teams work together, everyone stays on track. This stops teams from working alone and keeps them motivated.
Many companies use special plans to help with this:
Find the main business goals and connect CX goals to them.
Use SMART goals. These are clear, can be measured, and have a deadline.
Pick the most important CX goals by looking at customer happiness, business results, and feedback.
Choose numbers to measure success, like NPS, CSAT, and CLV.
Get help from leaders, customer teams, product, and marketing.
Make action steps with clear jobs and times.
Check progress and change goals if customers need something new.
Stitch Fix and HubSpot show how this works. Stitch Fix kept more customers by using AI for shopping. HubSpot lost fewer customers by making onboarding better.
Company | CX Objective | Action Taken | Measurable Outcome |
|---|---|---|---|
Stitch Fix | Increase customer retention | Personalized shopping with AI | Higher retention and lifetime value |
HubSpot | Reduce churn | Redesigned onboarding | Lower churn, higher satisfaction |
Measurable Objectives
Setting goals you can measure helps companies see progress. It also shows if CX spending works. Teams pick KPIs that fit their goals. Some KPIs are NPS, CSAT, CES, churn rate, and average resolution time.
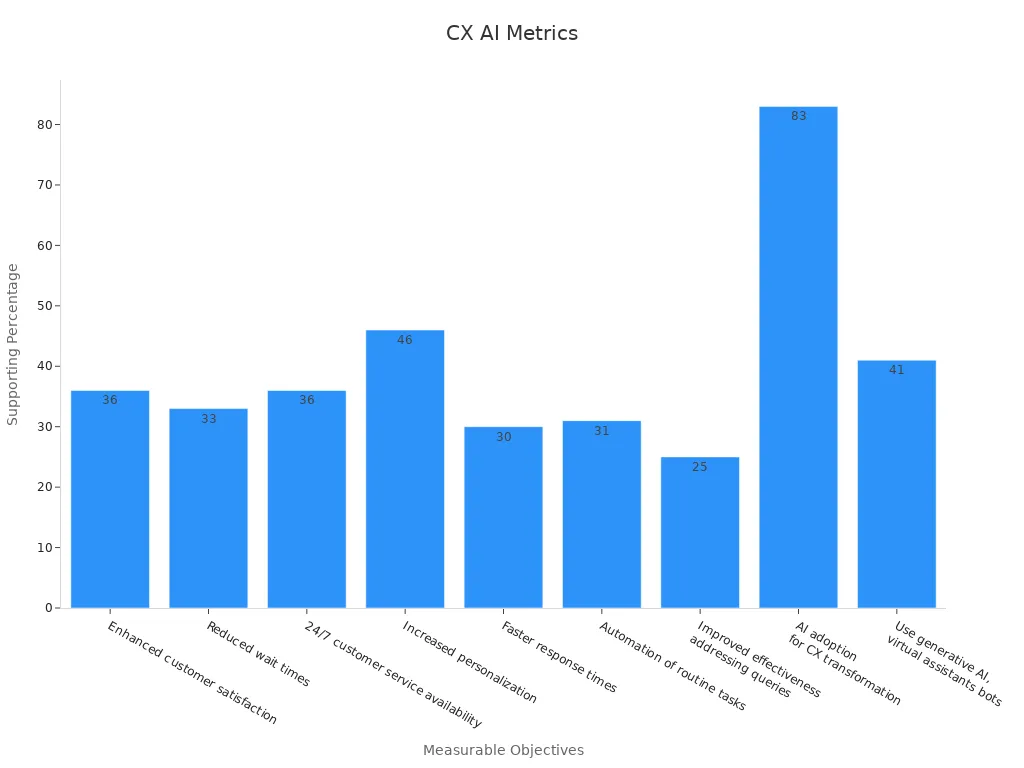
AI analytics makes these goals easier to check and improve. For example, 36% of companies say customers are happier after using AI. About 33% say wait times are shorter. Also, 46% of chatbot users get more personal help. Companies save time by letting AI do simple jobs.
A tool called AICE checks how AI changes customer experience. It looks at how well AI works on its own, if it is reliable, and if it can talk to people. Companies using these goals see happier customers, faster help, and more loyalty. By watching these numbers, leaders can show how CX helps the business.
Establishing Baselines
Initial Data Collection
Companies need a good starting point to see if customer experience gets better. They usually start by collecting old customer feedback, like surveys, Net Promoter Scores (NPS), and online reviews. If there is no old data, teams gather new information using important performance numbers. Using the same way to measure each time helps make fair comparisons.
Make clear goals for collecting data. This helps plan surveys and keeps everyone focused on customer experience.
Create surveys with both yes/no and open questions. This lets teams get numbers and stories from customers.
Test surveys with a small group first to make them easier to understand.
Use simple math to show results. Teams might also use special math, like t-tests, to find patterns.
Sort the starting data by customer type, product, or step in the process. This shows what is working well and what needs help.
Look for reasons behind the starting numbers to know what to fix.
Set goals for getting better based on the starting numbers.
Share the starting data and goals with everyone in the company so all teams work together.
Watch the starting numbers over time and check them again as things change.
Showing results with charts and graphs makes it easier for everyone to see trends and know where to work next.
Benchmarking
Benchmarking helps companies understand their starting numbers. They compare their customer experience numbers to others in the same industry, the best companies, and direct rivals. This shows where a company is strong and where it can do better.
Check customer experience numbers against industry averages.
Make goals based on the best companies, even in other fields.
Study rivals to see what they do well or not well.
Look at other industries for new ideas.
Use numbers from platform companies for more help.
Common standards like CSAT, CES, and NPS help measure happiness, how easy things are, and loyalty. Companies also use number benchmarks (like how fast they answer), text benchmarks (feelings from reviews), and brand benchmarks (market share and visit share). Inside the company, benchmarking shows which teams or places need help. Outside, it shows how the company compares to others.
Benchmarking helps companies keep getting better, gives clear answers, and helps focus on what matters most. Real-time feedback and AI analytics now make benchmarking quicker and more exact than before.
AI Analytics in CX

Data Collection
AI analytics changes how companies get customer data. New systems collect every call, email, chat, text, and survey. They also gather info from social media and screen recordings. These platforms use speech-to-text and machine learning to study all the data. No customer touchpoint is missed with this method. Companies can now look at all customer interactions, not just a few. This full view helps leaders see trends and find problems fast. It also helps them measure how happy customers are. CX leaders say AI makes simple tasks easier and gives teams better data. They suggest setting clear goals and using AI slowly to build trust and get good results.
Personalization
AI-powered personalization uses lots of customer data to make special experiences. Companies can send offers or messages based on what each person likes. They can also suggest products that fit each customer’s habits. This makes people happier and more loyal. Businesses see more sales and bigger orders. They also keep more customers. Netflix uses AI to suggest shows and saves $1 billion each year. Starbucks got 30% more from marketing by sending personal offers. Amazon says 35% of its sales come from AI suggestions. These examples show that personalization helps Customer Experience ROI.
Measurable Outcome | Description & Metrics | Example / Case Study |
|---|---|---|
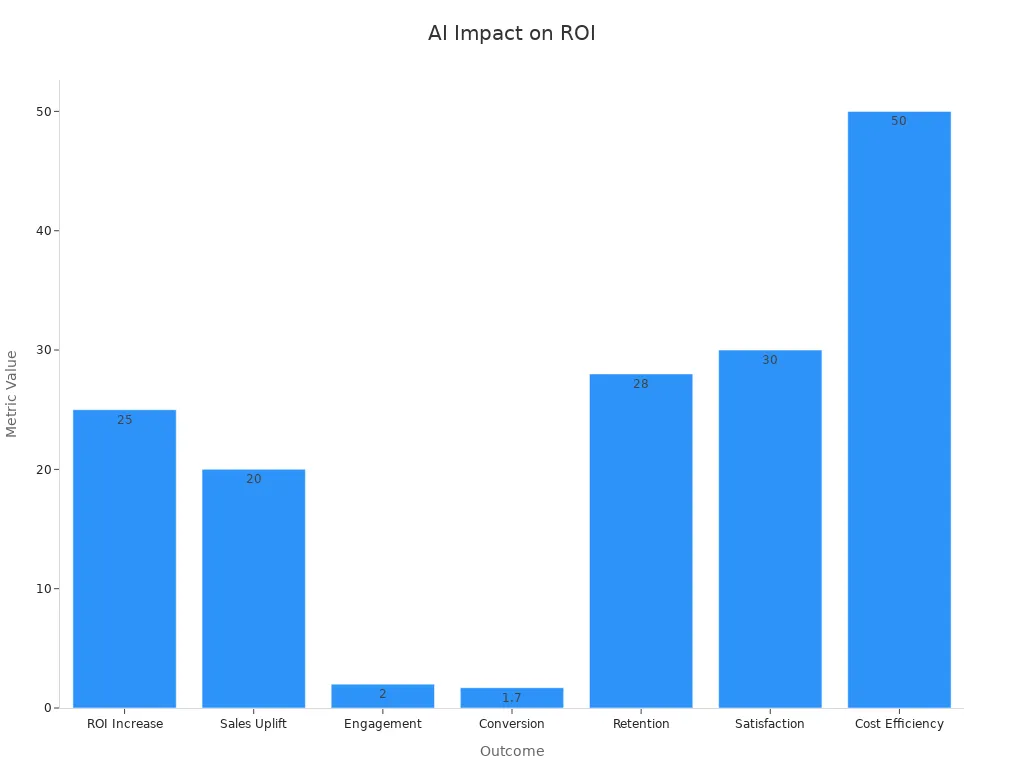
Marketing ROI Increase | Marketing ROI goes up by 25% on average. 72% of leaders say campaigns work better. Spend is 10-30% more efficient. | McKinsey report on personalization leaders |
Sales Uplift | Sales go up by about 20%. Companies that do well with personalization make 40% more money. | Boston Consulting Group findings; Amazon |
Customer Engagement | Engagement is twice as high. Personalized emails get six times more sales. | General industry data |
Conversion Rates | Campaigns have 1.7 times higher conversion rates. | General industry data |
Customer Retention | Churn drops by 28%. Netflix saves about $1 billion each year by keeping customers. | Netflix recommendation engine |
Customer Satisfaction & Loyalty | Satisfaction scores go up by 30%. 78% of people buy again when they get personal offers. | Starbucks AI-driven loyalty program |
Cost Efficiency | Customer acquisition costs drop by up to 50%. Marketing costs go down by 37%. | Industry reports |
Real-Time Insights
AI analytics gives real-time insights by looking at data right away. Teams can see feedback and scores as soon as they come in. They can also spot changes in customer behavior fast. This speed lets companies fix problems quickly. They can change their plans before things get worse. Real-time measurement helps companies stay ahead of customer needs. Leaders can watch key numbers and make choices that help both customers and the business.
AI analytics gives companies a full and current view of every customer interaction. This helps them give better service, keep customers loyal, and grow the business.
Calculating Customer Experience ROI

ROI Formula
Business leaders need an easy way to see if customer experience is worth the money. The most common way uses a simple math formula:
ROI = (Net Benefits / Total Costs) x 100
Net benefits are what a project earns after taking away all costs. Total costs mean money spent on things like technology, training, and running the business. This formula helps companies know if their work brings real value.
There are a few ways to figure out ROI for customer experience:
Return/Investment Model
ROI = Event Revenue / Event Expenses
If a company spends $5,000 and makes $15,000, the ROI is 300%. This way is fast but does not show profit margins.Incremental Revenue Model
ROI = (Event Revenue − Event Expenses) / Event Expenses
If a business spends $10,000 and gets $18,000, the ROI is 80%. This way looks at profit.Incremental Margin Model
ROI = (Gross Margin − Event Expenses) / Event Expenses
If revenue is $25,000, cost of goods sold is $5,000, and expenses are $15,000, the ROI is 33%. This way includes profit margins.Multi-Touch Attribution Model
This way splits revenue between things like marketing, sales, and support. It helps companies see which steps matter most.Customer Lifetime Value (CLTV) Integration
This way looks at how much each customer is worth over time. If 100 customers each bring $500, the total is $50,000. This helps companies plan ahead.
Companies also check the ratio of customer lifetime value to customer acquisition cost. A good ratio is 3:1. This means each customer brings in three times more than it costs to get them. This helps leaders know if their spending is smart.
Cost Savings and Revenue
AI analytics help companies save money and make more money in many ways. The table below shows how different AI tools help businesses:
AI Use Case | Impact Type | Measurable Metrics / Outcomes | Example Detail |
|---|---|---|---|
Personalization Algorithms | Revenue Growth | Higher sales conversion rates, more sales revenue | AI upsell model in call center generated $2 million extra annual sales compared to other regions |
AI Chatbots | Cost Savings | Lower customer service handle time, labor cost savings | 20% drop in handle times saved $150,000 yearly and cut agent turnover by 15% |
Error Reduction Systems | Cost Savings & Quality | Fewer defects, lower error rates | AI vision system cut defect rate from 5% to 3%, saving on rework and boosting satisfaction |
Customer Experience Metrics | Revenue & Retention | Higher NPS, CSAT, lower churn, better first-contact resolution | 7-point NPS rise linked to 1% revenue growth; 10-point NPS jump led to 3.2% more upsell sales |
Decision Support AI | Cost Savings & Revenue | Faster decisions, lower inventory costs | Quicker supply chain choices reduced costs and improved fill rates, raising revenue |
Innovation Enablement | Revenue Growth | More new products, bigger market share | AI sped up R&D, leading to new launches and patents |
Companies using AI for customer experience get real results. For example, AI triage tools cut agent handle times by 20%. This saved $150,000 a year and lowered turnover. A 7-point rise in Net Promoter Score can raise revenue by 1%. Keeping 5% more customers can grow profits by up to 95%.
Financial and operational numbers show how AI analytics help:
Metric Category | Metric Description | Quantitative Impact / Example |
|---|---|---|
Financial Metrics | Return on Investment (ROI) | Average ROI of 4.3:1 over 3 years (Deloitte, 2024) |
Payback Period | Median payback ~14 months (McKinsey, 2024) | |
Operational Metrics | Cycle Time Reduction | Incident resolution time cut by 37%-50% (Forrester, 2023) |
Manual Effort Reduction | 42% less routine IT work (IDC, 2024) | |
Error Rate Reduction | 30% fewer critical defects, 40% more testing coverage (Gartner, 2024) | |
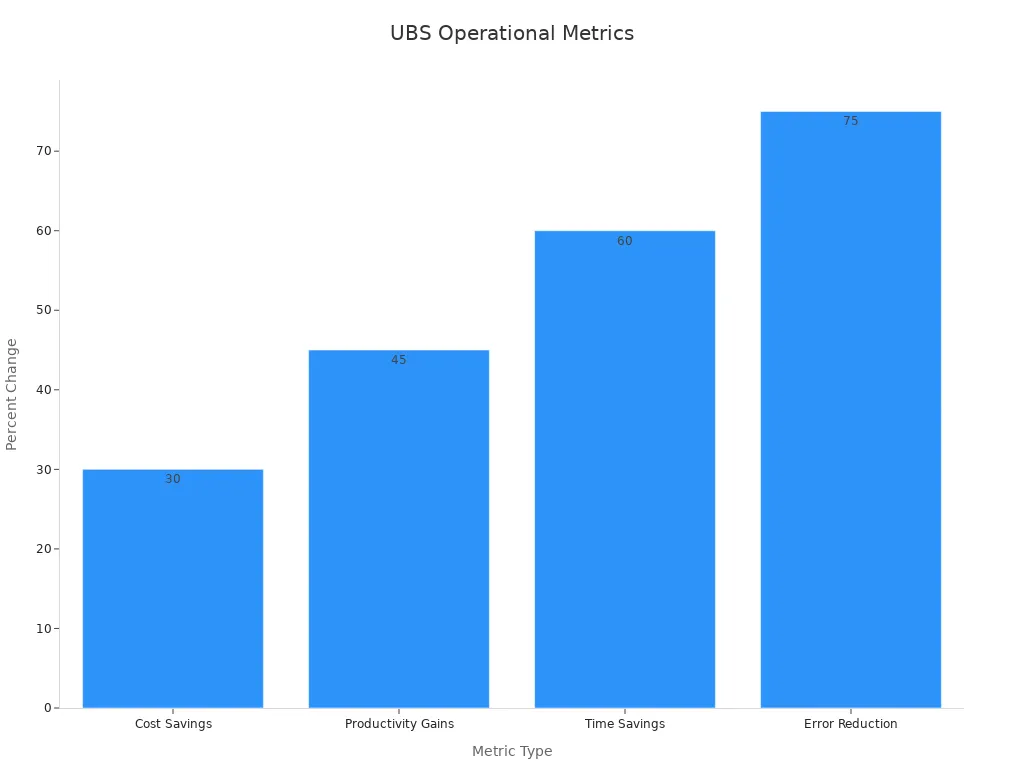
Case Study: UBS Group | Cost Savings | 30% lower routine IT costs |
Productivity Gains | 45% more employee productivity | |
Time Savings | 60% less document processing time | |
Error Reduction | 75% fewer transaction errors | |
Financial Outcome | 310% ROI over 3 years; 55% from cost savings, 25% productivity, 15% risk reduction, 5% new revenue |
Companies can use frameworks like the value chain to link customer happiness, cost, and revenue to business results. For example, better first-contact resolution rates lower costs and raise revenue. Each 1% rise in this rate can cut service costs by up to 20% and boost revenue by 15%. When companies improve customer effort scores, they can save up to $1 million a year in support costs.
Customer Experience ROI comes from saving money and making new revenue. AI analytics help companies measure these gains, make smarter choices, and show the value of their customer experience programs.
Communicating Results
Data Visualization
Data visualization makes hard customer experience data easy to see. Teams use charts and graphs to show how scores change over time. Bar charts and line graphs help compare results from different times. Pie charts and bar graphs show how customer satisfaction rates are spread out. This makes it easy to see how well the company is doing.
Teams look at important numbers like Net Promoter Score (NPS), Customer Satisfaction Score (CSAT), and Customer Effort Score (CES).
Visuals show patterns, trends, and things that stand out in the data.
Charts and graphs help everyone find problems and wins fast.
Visualization is more than just showing numbers. It helps teams turn feedback into ideas they can use. Leaders use these visuals to share what they find and help make better choices.
Stakeholder Buy-In
Getting stakeholder buy-in is very important for AI customer experience projects. Data storytelling helps a lot. Teams use stories and pictures together to make data easy to understand. This helps stakeholders feel and think about the results.
Interactive tools like Tableau, Power BI, Google Data Studio, and Domo let stakeholders look at data right away.
Fun formats, like infographics and dashboards, show big trends and make ideas easy to remember.
Presentations with visuals and real stories build trust and help people talk openly.
Working together and being open during talks builds trust. When stakeholders can ask questions and see clear pictures, they feel sure about the choices. Changing messages to fit what stakeholders care about helps get strong buy-in for AI-powered CX changes.
Continuous Improvement
Monitoring KPIs
Companies need to watch their KPIs to get better at customer experience. Teams check numbers like Customer Satisfaction Score (CSAT), Net Promoter Score (NPS), churn rate, and average rating. These numbers tell how customers feel and how the company is doing. Teams use both old and new data to find patterns and spot problems early. Automated tools gather data from places like Google Analytics, social media, and PPC sites. This makes work easier and helps avoid mistakes. KPI dashboards show results in a simple way. They help teams see trends and act quickly. Teams look at different KPIs, like click-through rates and engagement, to understand customer happiness. Predictive analytics and data from many places help teams guess future trends and plan well. When companies use good data and clear dashboards, everyone trusts the results and keeps getting better.
Collecting good data all the time and comparing it helps teams see progress and make smart choices.
Optimization
Optimization means making customer experience better, one step at a time. Teams use trusted models to help them improve. The table below lists some popular improvement models and what they do:
Quantitative Performance Improvements | Supporting Examples | |
|---|---|---|
Six Sigma DMAIC | Better quality, fewer mistakes, strong ROI | Motorola, GE, Bank of America, 3M |
Toyota Production System (TPS) & Kaizen | Less waste, better quality, more efficiency and satisfaction | Toyota, Boeing, Virginia Mason Medical Center, Amazon |
Lean Startup Build-Measure-Learn | Faster learning, better products, less waste | Startups using MVPs and quick feedback |
Continuous Integration/Deployment (CI/CD) | Faster feedback, fewer mistakes, better quality | Software teams making code and delivery faster |
Teams often use A/B tests to see which changes work best. They track KPIs like customer lifetime value, churn rate, and sales conversion rates to see how they are doing. Teams mix numbers with customer feedback to know what needs fixing. Looking at the whole customer journey, not just one part, brings bigger improvements. Real-time tracking and AI analytics give teams the information they need to keep getting better.
Companies that keep making customer experience better have more loyal customers, keep more people, and grow faster. Continuous improvement helps them stay ahead in a changing world.
Case Studies
Success Stories
Many companies have gotten great results with AI analytics. Vodafone used AI chatbots and cut cost-per-chat by 70%. Lula Loop raised its CSAT score by 40% using generative AI chatbots. TelOne now answers over 20,000 questions each month with AI, which made response times faster. AI self-service tools stopped 43% of tickets, so ticket numbers dropped by half. BTVI used AI chatbots to stop 40% of chats, which helped keep more customers. An IDC–Microsoft study showed an 18% rise in consumer satisfaction and a 250% average ROI from generative AI. One company made handle times 20% shorter, saving $150,000 a year and cutting agent turnover costs by 15%. Experts think CSAT could go up by 40% and ROI could rise over 20% in banking, finance, and insurance with AI-driven customer experience.
Company | AI Strategy Description | Numerical Benefits Achieved |
|---|---|---|
Ford | Personalized vehicle recommendations in dealerships | 15% more engagement; 10% more sales |
McDonald's | AI-driven menu customization at drive-thrus | 6% higher average order size; faster service |
H&M | Inventory management and customer preference analysis | 14% more sales; better customer satisfaction |
Hilton Hotels | Chatbots for guest booking and recommendations | 20% more positive feedback; 10% shorter check-in times |
Nike | Personalized e-commerce shopping experiences | 30% more online sales; higher customer loyalty |
L’Oréal | Virtual beauty consultations | 20% more online sales; 25% better customer retention |
Toyota | Predictive maintenance alerts | 40% fewer breakdowns; 15% more customer satisfaction |
Delta Airlines | Predictive customer service | 12% more customer satisfaction; 10% fewer complaints |
AT&T | Chatbots for customer support automation | 80% inquiries resolved by AI; 25% lower costs; 15% more satisfaction |
Walmart | Supply chain optimization | 30% less excess inventory; 20% more customer satisfaction |
UnitedHealth | Predictive healthcare services | 25% fewer readmissions; 20% more patient satisfaction |
Adobe | Personalized marketing campaigns | 15% more engagement; 10% better conversion rates |
Tesla | Autonomous driving and customer experience | 30% more customer satisfaction |
AI analytics help companies see how Customer Experience ROI improves. They show clear gains in satisfaction, loyalty, and cost savings.
Lessons Learned
Companies learned some important things from these AI projects:
Set clear goals and check progress often.
Use AI for easy jobs so staff can do harder work.
Personalization helps keep customers and boosts sales.
Real-time data lets teams fix problems fast.
Sharing results with all teams builds trust and keeps everyone focused.
Update AI models often to match what customers want.
AI analytics give leaders tools to track progress and make smart choices. Teams that follow these lessons get happier customers, lower costs, and better Customer Experience ROI.
Companies can make customer experience better by using simple steps. First, they set clear goals and gather data. Then, they use AI analytics to get real-time insights. AI helps teams make things personal for each customer. It also guesses what might happen next and can handle support jobs. Teams notice more sales, stronger loyalty, and smoother work.
AI looks at data right away so teams can act fast.
Predictive analytics help find customers who might leave soon.
Automation makes support easier and keeps agents happy.
Good data privacy helps people trust the company.
Leaders who use AI and focus on data will do well. Try new tools and keep learning to give customers a better experience.
FAQ
What is Customer Experience ROI?
Customer Experience ROI tells how much a company gets from making customer interactions better. It shows if the company makes more money and if customers are happier. Leaders look at this number to see if spending on customer experience is worth it.
How does AI analytics improve CX measurement?
AI analytics checks all customer interactions. It quickly finds patterns and trends. Teams use what they learn to make better choices. AI also helps companies fix problems faster when they happen.
Which metrics matter most for CX ROI?
Important metrics are Net Promoter Score (NPS), Customer Satisfaction Score (CSAT), Customer Effort Score (CES), and customer retention rate. Companies watch these numbers to know if their customer experience plans work.
Can small businesses use AI analytics for CX?
Yes! Many AI tools now work well for small businesses. They are easy to set up and have simple dashboards. Small teams can use these tools to watch customer feedback and make service better without spending a lot.
See Also
Key SEO Trends And Forecasts To Watch In 2024
A Detailed Guide To Conducting Competitor Analysis Effectively
Strategies For Analyzing Content To Beat Your Competition
Exploring Top B2B Content Marketing Trends For 2024
Comprehensive Tips For Achieving Success In SaaS Content Marketing