How to Measure Content Performance

If you can’t show how content moves the numbers that matter, it’s just opinion versus opinion. This guide gives you a no-drama, GA4-centered workflow to measure content performance, attribute impact, and make better bets—without ignoring privacy realities.
Step 1: Start with business outcomes (then pick metrics that prove them)
Content exists to drive outcomes: awareness, engagement, lead generation, revenue, and retention. Map each content type to a funnel stage and define the questions you’ll answer. For awareness, identify which articles act as landing pages for new audiences and the channels that introduce them. For engagement, find the pieces that keep people reading and interacting. For conversion, zero in on content that sparks newsletter signups, demo requests, trials, or purchases. For revenue and retention, track which content influences pipeline or repeat purchases. Primary metrics roll up to these questions; secondary metrics explain the “why.” Keep a one-page measurement plan per content type with metric definitions and targets.
Step 2: Instrument GA4 so events and conversions actually work
GA4’s engagement metrics (engaged sessions, engagement rate, average engagement time) come from an event-based model documented in the official GA4 schema. For canonical metric names and definitions, refer to Google’s Analytics Data API schema via the developers documentation in the section for metrics and dimensions: Google Analytics Data API schema. For bounce rate context—remember it’s the inverse of engagement rate in GA4—this explainer is clear and up to date: Loves Data on GA4 bounce rate.
What to set up now:
- Enhanced Measurement: Turn it on (Admin > Data streams > Web > Enhanced measurement). It covers page views, scroll (default ~90%), outbound clicks, file downloads, and basic video/form events. Verify in Realtime and DebugView.
- Custom events: Track meaningful mid-journey actions (e.g.,
scroll_25,scroll_50,video_complete,form_start,form_submit) either in GA4’s Create event or via GTM. The official guide to sending custom events is here: Google Developers — GA4 event setup. - Key events (conversions): Mark your true goals as key events (Admin > Data display > Events). Separate micro (newsletter, ebook) from macro (demo, purchase) so you can see assisted influence vs. direct impact.
- Content groupings (optional but recommended): Pass parameters like
content_group,author, ortopicand register them as custom dimensions. This lets you compare performance by author, category, or series in one click.
A quick QA ritual before launch: open GTM Preview, trigger your flows, watch events arrive in GA4 DebugView, and confirm parameters are spelled exactly as registered. Five minutes here saves weeks of bad data.
Step 3: UTM hygiene and channel groupings
Attribution falls apart without clean campaign tagging. Establish a simple UTM taxonomy and stick to it: require utm_source, utm_medium, and utm_campaign (lowercase, no spaces), forbid UTMs on internal links, and test every link before publishing. A concise, current reference that codifies these best practices: InfoTrust on UTM parameters in GA4.
Then align GA4 to your taxonomy with custom channel groupings (Admin > Data settings > Channel groups). Create rules for sources like Newsletter, Organic social, Partner referrals, and Communities so reporting matches how your marketing actually works.
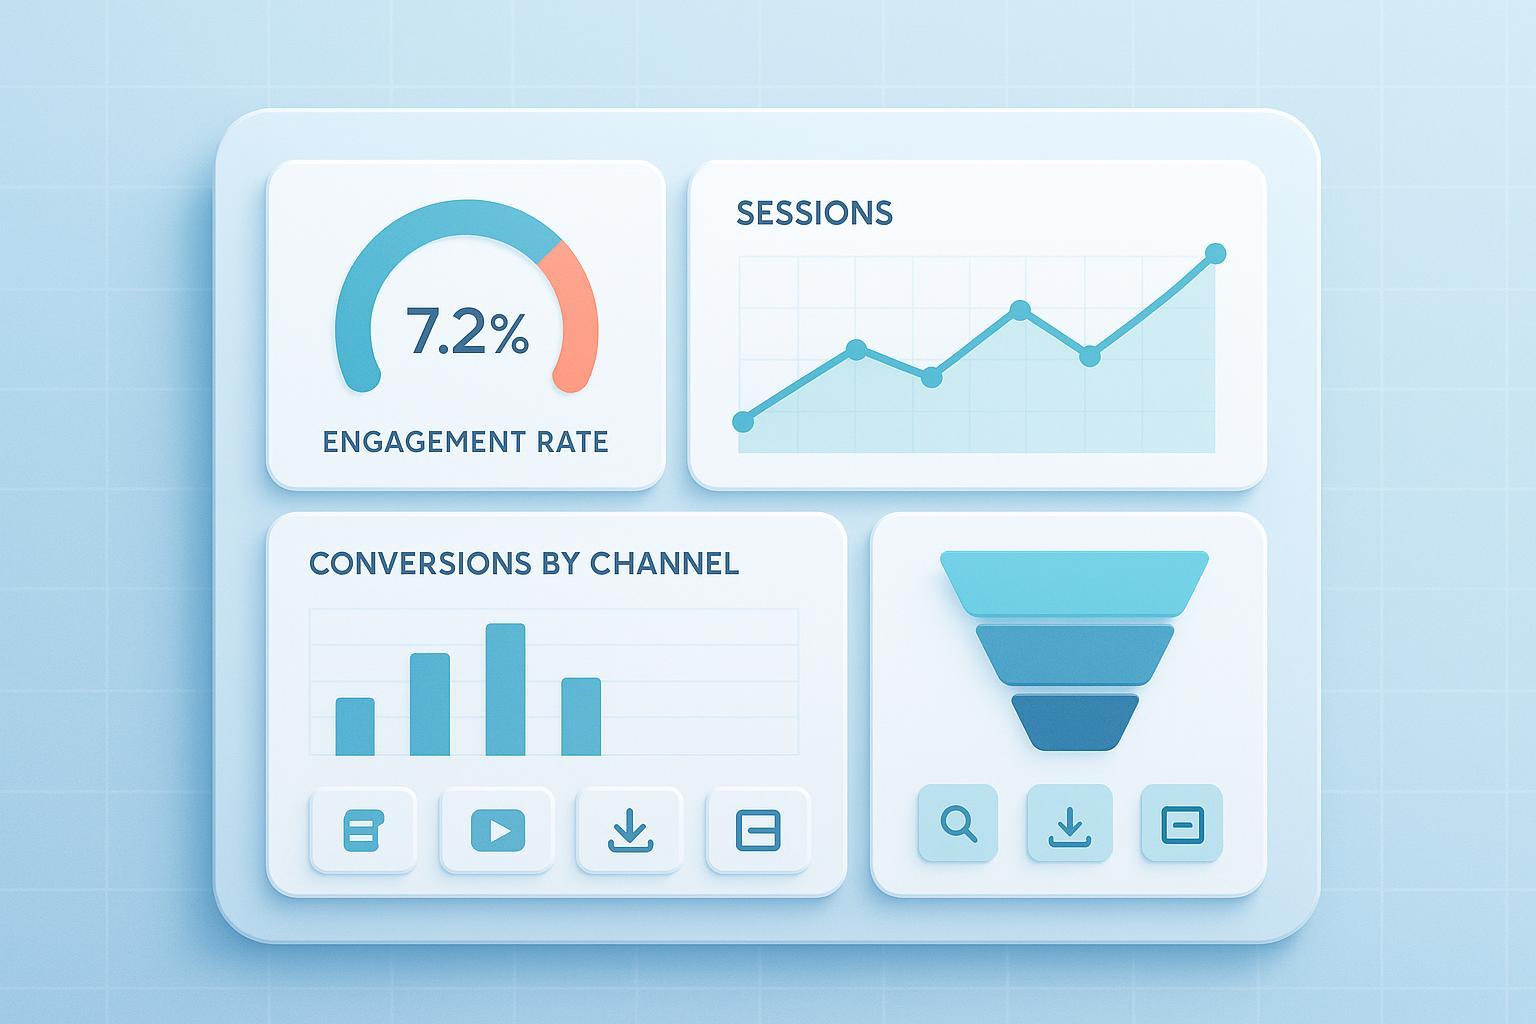
Step 4: Build a practical dashboard (Looker Studio)
You want fast insight at two levels: per-article and portfolio. Connect GA4 via the Data API for speed, or BigQuery for deeper control. If you’re unsure when to use which—and why numbers sometimes differ—this comparison explains trade-offs and discrepancies well: InfoTrust — GA4 Data API vs BigQuery.
What to include:
- Scorecards: Users, engaged sessions, engagement rate, average engagement time, key event counts, and conversion rate.
- Landing page tables: Users, sessions, engagement rate, conversions; add filters for date range, channel group, content group, and landing page.
- Funnels: From landing view to key event completion, segmented by channel.
- Scroll and video visuals: If you built custom events, plot distributions to see if people actually consume the content.
Expect small differences between GA4 UI, the Data API, and BigQuery due to processing windows and modeled data. Document this on the dashboard to set expectations.
What to measure (and how to use it)
Start with engagement. Engagement rate equals engaged sessions divided by all sessions; use it to compare articles, but always segment by channel—email and branded search should behave differently than cold social. Average engagement time is a tighter signal than raw time on page; chase outliers and patterns instead of universal targets. For scroll depth, track 25/50/75/100% so you can spot thin intros, TL;DR behavior, or long-form winners.
Then look at conversion. Treat newsletter signups and ebooks as micro-conversions—healthy content portfolios generate these steadily as leading indicators. Demos, trials, and purchases are your macro-conversions. Calculate per-article conversion rates from landing sessions with a simple fraction: macro conversions on an article divided by landing sessions on that article.
Finally, segment for insight. Compare by channel (Organic search vs. Email vs. Social) to set realistic targets; group by author, category, or topic to inform your editorial calendar; and watch new versus returning users—returning audiences often show higher completion and a stronger intent to convert.
Attribution and ROI: assign fair credit (without overpromising)
GA4’s data-driven attribution (DDA) is the default model. Use Advertising > Attribution for Model comparison and Conversion paths, and adjust lookback windows in Admin. Google documents the reporting locations and settings here: Google Support — Attribution in GA4.
Practical guidance: First, validate that you have enough conversion volume for DDA to stabilize; otherwise, compare against simple heuristics (position-based or time-decay) to avoid overfitting. For assisted influence, use Conversion paths to identify content that appears early- or mid-journey and measure its contribution under different models. B2B teams should also track opportunity creation and pipeline influence alongside GA4, pairing fractional credit with CRM-stage metrics like time to MQL/SQL and velocity changes.
A simple ROI frame you can defend: For direct content ROI per piece, compute ((revenue directly attributed to the article) − (cost to produce + promote)) ÷ cost. For assisted content ROI at a portfolio level, assign fractional revenue based on the share of conversions where the content participated (per your chosen model), then apply the same formula. State your window and model; that transparency builds trust.
Privacy-first reality: modeled data and safer tagging
Consent Mode v2 signals whether analytics and ads storage are allowed; when denied, GA4 blends in modeled conversions and sessions in the interface. That means fewer observed users and more modeled totals, especially in the EEA. To implement and debug consent signals across tags, use this canonical guide: Google Developers — Consent debugging.
Server-side tagging can improve performance, data control, and resilience by moving tag execution to a first-party endpoint. It won’t magically recover consented data you didn’t earn, but it often reduces data loss from blockers and gives you parameter governance. Budget for setup and hosting, and test thoroughly.
How to interpret numbers under consent: Expect drops in observed sessions when you switch on Consent Mode; that’s normal. Modeled totals can rise relative to observed. BigQuery exports do not contain modeled users, while GA4 UI reports can—so don’t expect exact parity.
Benchmarks and targets (treat as directional)
Use these as starting ranges, then build your own baselines by channel and content type.
| KPI | Directional range | Notes |
|---|---|---|
| Engagement rate (GA4) | ~56–65% median across many industries | See aggregated medians summarized by Databox (2024–2025 cohort): Content marketing engagement benchmarks |
| Average engagement time | 40–60s for many B2B blogs; 2–5 min for rich media | Highly variable by vertical and format; rely on internal trends |
| Macro conversion rate | 1–4% e‑commerce; 2–5% B2B lead gen offers | Calibrate by offer friction and channel |
| Scroll depth | Build internal baselines for 25/50/75/100% | No dependable cross‑industry standard |
Caveats: Modeled data, consent, and content mix limit cross-site comparisons. GA4’s benchmarking feature can provide peer percentiles; still, prioritize your own trendlines.
Troubleshooting fast
- Missing or double-counted events: In GTM, confirm the GA4 config fires before custom events; in GA4 DebugView, check event order and parameters. Re-run with consent simulation if you use a CMP.
- “Direct/Unassigned” spikes: Ensure consent is set before
page_view/session_start, preserve UTMs across redirects, and review your channel group rules. - Conversions vanished after Consent Mode v2: Verify
ad_storage/ad_user_datastates, confirm CMP updates reach GTM, and review platform diagnostics. The consent debugging guide above is your best friend here.
Cadence and continuous improvement
Weekly: Flag top risers/decliners, fix obvious issues (broken tags, wrong UTMs), and share 2–3 wins/learnings with the team.
Monthly: Report performance vs. goals, segment by channel and content group, and recommend next steps (double down, iterate, pause).
Quarterly: Review attribution/ROI, evaluate cohort behavior by content type, and reallocate budget. For SEO, audit for content decay and decide whether to refresh or relaunch.
Detect and fix content decay. Watch for a 10–20% traffic decline over 90–180 days, rank drops from top-3/top-10, engagement time down 15–25%, or impressions rising while CTR falls. Prioritize with RICE or a simple Traffic × Conversion × Business value score to focus on the highest‑impact fixes. The refresh playbook: update stats and examples, improve structure and headings, strengthen internal links and CTAs, add FAQs/schema, republish, and track reindexing.
Bring it all together
Think of this as your measurement flywheel: instrument cleanly, tag consistently, visualize clearly, segment smartly, attribute fairly, and improve relentlessly. Do that, and “what did this article do for the business?” becomes a question you’re happy to answer.