How to Add Real Data to AI Content

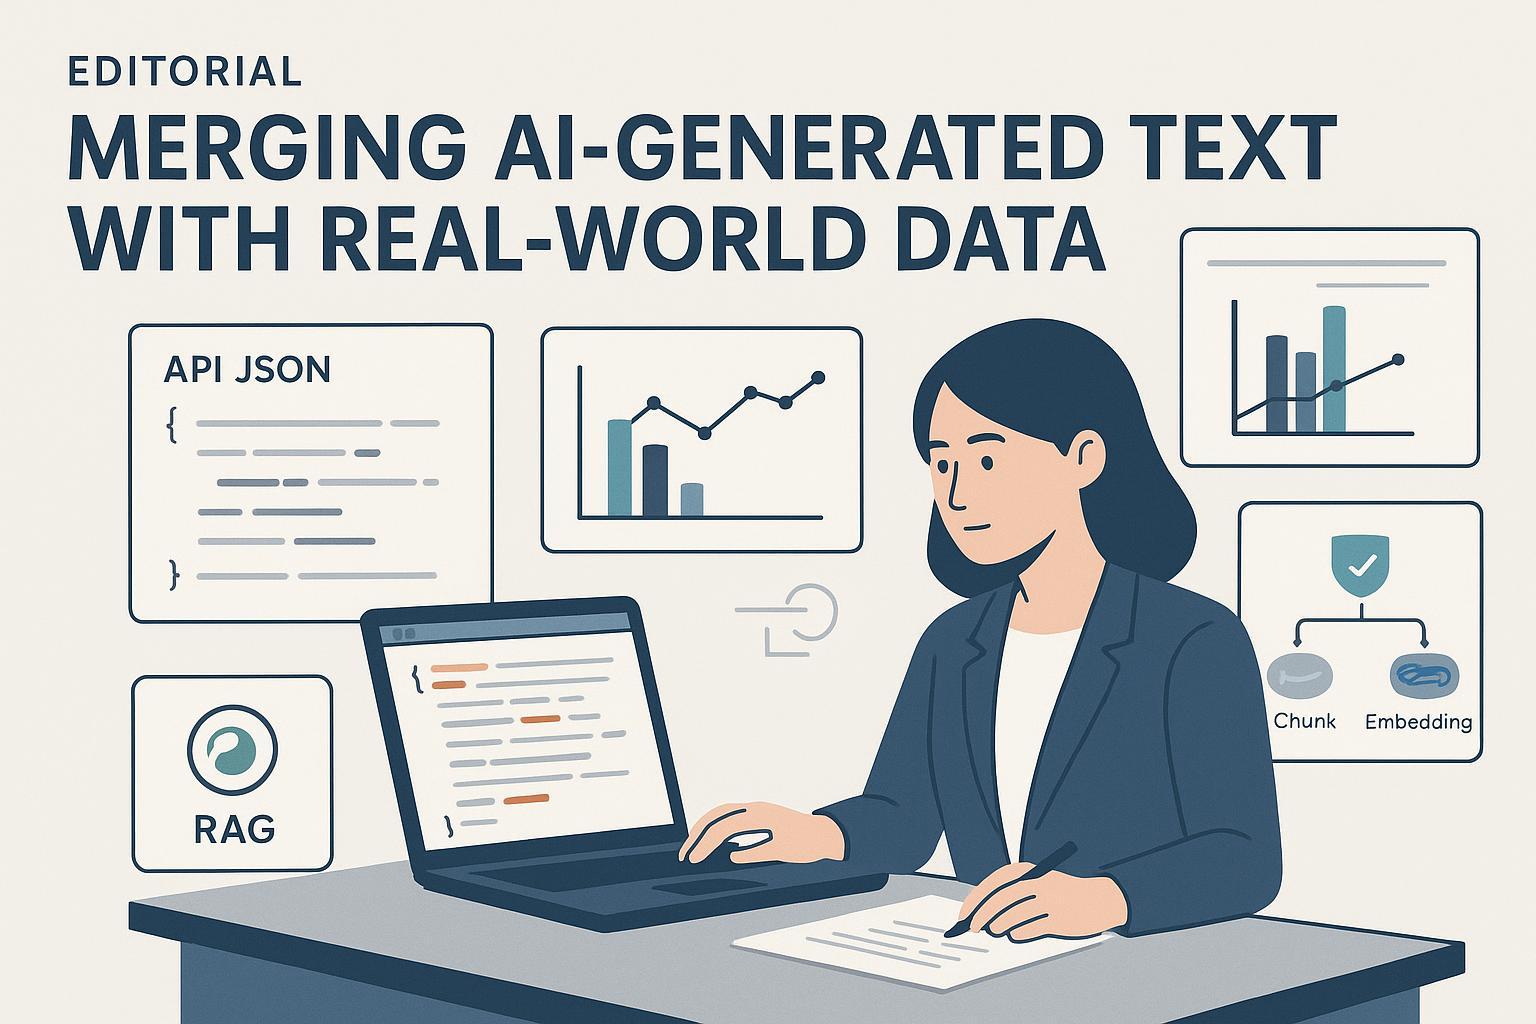
If you’ve ever read an AI draft that confidently drops a statistic you can’t verify, you know the risk: trust evaporates fast. The fix isn’t magic—it’s a disciplined workflow that pulls in sources you can point to, tracks how numbers got there, and makes that trail visible to readers and search engines. Below is a practical, end‑to‑end method you can use on your next article, report, or landing page.
Choose your grounding approach
There are two reliable ways to bring real data into AI outputs. Think of them as “bake it into the prompt” versus “wire it into the system.”
- Retrieval‑Augmented Generation (RAG): Your system retrieves authoritative context (docs, data snippets) at answer time and feeds it to the model. RAG reduces hallucinations by asking the model to write only from retrieved evidence rather than memory. For a clear definition and architecture overview, see AWS, “What is Retrieval‑Augmented Generation (RAG)” (2025).
- Inline sourcing (manual or assisted): You or your tool pull specific numbers (e.g., via an API) and paste them into the prompt as cited facts. This can be faster for small jobs and editorial workflows without engineering support.
| Approach | When it shines | What it needs | Common pitfalls |
|---|---|---|---|
| RAG pipeline | Ongoing Q&A, multi‑source briefs, large corpora | Curated knowledge base, vector search, retrieval evaluation | Poor chunking or metadata leads to weak retrieval |
| Inline sourcing | Single posts, small teams, fixed statistics | Good prompts, API access, careful citation | Stale stats, missing units/time windows |
If you’re unsure, start inline for one page, then graduate to RAG once you repeat the pattern or need scale.
Prepare a knowledge base for RAG (if applicable)
RAG is only as good as what you let it retrieve. Structure and freshness matter more than volume.
- Chunk with context: Split documents into chunks that are big enough to be meaningful but small enough to retrieve precisely. Microsoft’s guidance explains practical chunking strategies and overlap in Azure’s “How to chunk documents for vector search” (2025). Record the chunking rules and the embedding model version so you can reproduce results.
- Enrich with metadata: At ingest time, attach source URL, section title, publication date, version IDs, and a “last verified” timestamp to each chunk. This allows filtered retrieval (e.g., only 2024–2025 stats) and supports audits.
- Keep it fresh: Schedule incremental ingests aligned to your domain—weekly for marketing pages, daily for fast‑moving datasets. Validate retrieval quality regularly; if relevant passages aren’t being pulled, revisit chunk sizes, overlap, and hybrid (keyword + semantic) retrieval.
A useful mental model: your KB is a library, not a junk drawer. Curate it.
Pull trustworthy numbers from public APIs
When you need live or frequently updated statistics, pull them directly from authoritative providers and keep the metadata. For multi‑domain data with provenance baked in, Data Commons REST API v2 documentation (2025) explains how to request time‑series and point statistics along with measurement methods and sources. For domain‑specific stats, consider agencies like CDC, NOAA, or World Bank via their official developer portals.
A minimal workflow looks like this: identify the exact variable and geography; request the time window you plan to cite; store the value along with units, the dataset name, the variable ID, the API endpoint, and a retrieval timestamp; then pass the value and its source into your prompt or template. If your CMS supports it, save the record in a “data citations” field attached to the page.
Two small tips that prevent big headaches: always note the units (“billion USD,” “%,” “µg/m³”) and the date window you’re claiming. And when an API updates infrequently, cache the value locally with the retrieval date so you can show your work.
Verify, cite, and disclose
Google’s stance is straightforward: what matters is helpful, people‑first content backed by expertise and trust, regardless of authorship method. See Google Search Central’s “Google Search and AI‑generated content” (2023) for policy framing and examples.
Before you publish, run a quick verification pass. You can adapt this checklist to your CMS workflow:
- Confirm every number against the original source (not a reprint or blog). Ensure units and date range match the claim.
- Add an anchor‑text citation that names the publisher and document, with the year visible in the prose.
- If the model produced phrasings close to the source, paraphrase and quote judiciously; cite where appropriate.
- If you used AI assistance materially, add a brief disclosure (see template below) and include the human reviewer’s name/title if your policy requires it.
Templates you can paste into your style guide:
Source attribution template (inline):
According to the Publisher, “Document Title” (Year), X increased by Y% between 2020 and 2024.
AI‑assistance disclosure (footer or author note):
Drafting assistance was provided by a large language model. All statistics and claims were verified against cited sources by [Editor Name], [Title].
Track provenance and make it machine‑visible
Readers aren’t the only audience for your sources—search engines and internal auditors are too. Keep a private audit trail and publish structured hints.
- Internal audit trail: For each published number, store the raw value, units, date window, source URL, retrieval timestamp, and the human who approved it. That’s your chain of custody.
- Standards to know: W3C’s provenance model shows how to represent “who did what when” across entities, activities, and agents. See W3C, “PROV‑JSONLD Submission” (2024) for a practical serialization that can map to your logs.
- Make it discoverable: Where it makes sense, add structured data so machines can understand your datasets and fact checks. Even simple usage of Dataset or DataCatalog can help orientation later. If you publish fact‑checked claims, consider ClaimReview. Implementations vary, so start small and align to your CMS.
Visualize data without distorting it
A clean chart can clarify an argument—or quietly mislead if labels or windows are off. Good practice is well documented in the public sector. The UK government’s Analysis Function lays out clear, visual rules on titles, axes, units, and accessibility in “Data visualisation: general formatting rules” (2023).
When you turn stats into charts or tables, double‑check that the title names the metric, geography, and time frame; axes carry units; the source and “last updated” appear under the figure; and color choices meet accessibility standards. If a dataset changes methodology mid‑series, annotate it.
Maintain and refresh
Real data goes stale. Set expectations now for when and how you’ll update.
Define update cadences per metric—daily for volatile operational dashboards, monthly for program metrics, quarterly for macroeconomic indicators. In your CMS, store “last verified” with a date and create reminders. When a source publishes new values, run a quick QA: confirm the variable is the same, units didn’t change, and any index rebasing is accounted for. If you use RAG, schedule re‑ingestion and re‑embedding of affected documents and spot‑test retrieval quality after updates.
A lightweight but effective practice is to keep a changelog on evergreen pages: when a number changes, add a one‑line note with the date and reason (e.g., “Updated GDP figure to 2024 World Bank release; units: current US$”). It’s transparent and helps future you.
Troubleshooting quick hits
- Hallucinations persist with RAG? Test retrieval quality. Increase chunk overlap, try hybrid retrieval, or add a reranker. Ensure prompts instruct the model to quote and cite from retrieved text only.
- Numbers look off? Check API parameters, date filters, and units. Confirm the variable ID, and make sure caches were invalidated after updates.
- Broken or low‑trust sources? Prefer canonical docs and APIs from recognized authorities. If provenance is unclear, don’t cite it.
Where to start this week
Pick one evergreen article that mentions a statistic, and implement the full loop: pull the latest number via an official API, store units and date window, cite it with a publisher‑named anchor link, add a short AI‑assistance disclosure if used, and log the provenance internally. Next, schedule a monthly reminder to re‑verify. Once this feels routine, consider piloting a small RAG stack for recurring questions and briefs.
Real data doesn’t just make AI content accurate—it makes it accountable. Build the habit, and your readers will feel the difference.