Causal Lift (Geo/PSA): The Gold Standard for Measuring True Marketing Impact

How Do You Really Know Your Campaign Worked?
Picture this: You just launched a content campaign, poured hours into a SaaS demo push, and watched conversion rates spike in your dashboard. Did your marketing cause those results—or did you just get lucky with timing, seasonality, or platform reporting quirks? You’re not alone if you’ve asked: “Am I measuring what matters? Is my ‘attribution’ actually showing causality?”
What Is Causal Lift—In Plain English
Causal Lift is a way to answer, with scientific confidence, whether your marketing activity causes a measurable difference in outcomes—like leads, demo requests, or purchases—compared to doing nothing (or running a neutral message). It borrows logic from clinical trials: You split your audience into two comparable groups, run your campaign for one and hold out on the other, and compare the difference. That difference is your causal lift (Haus.io’s Incrementality Testing, 2024).
Why Geo/PSA?
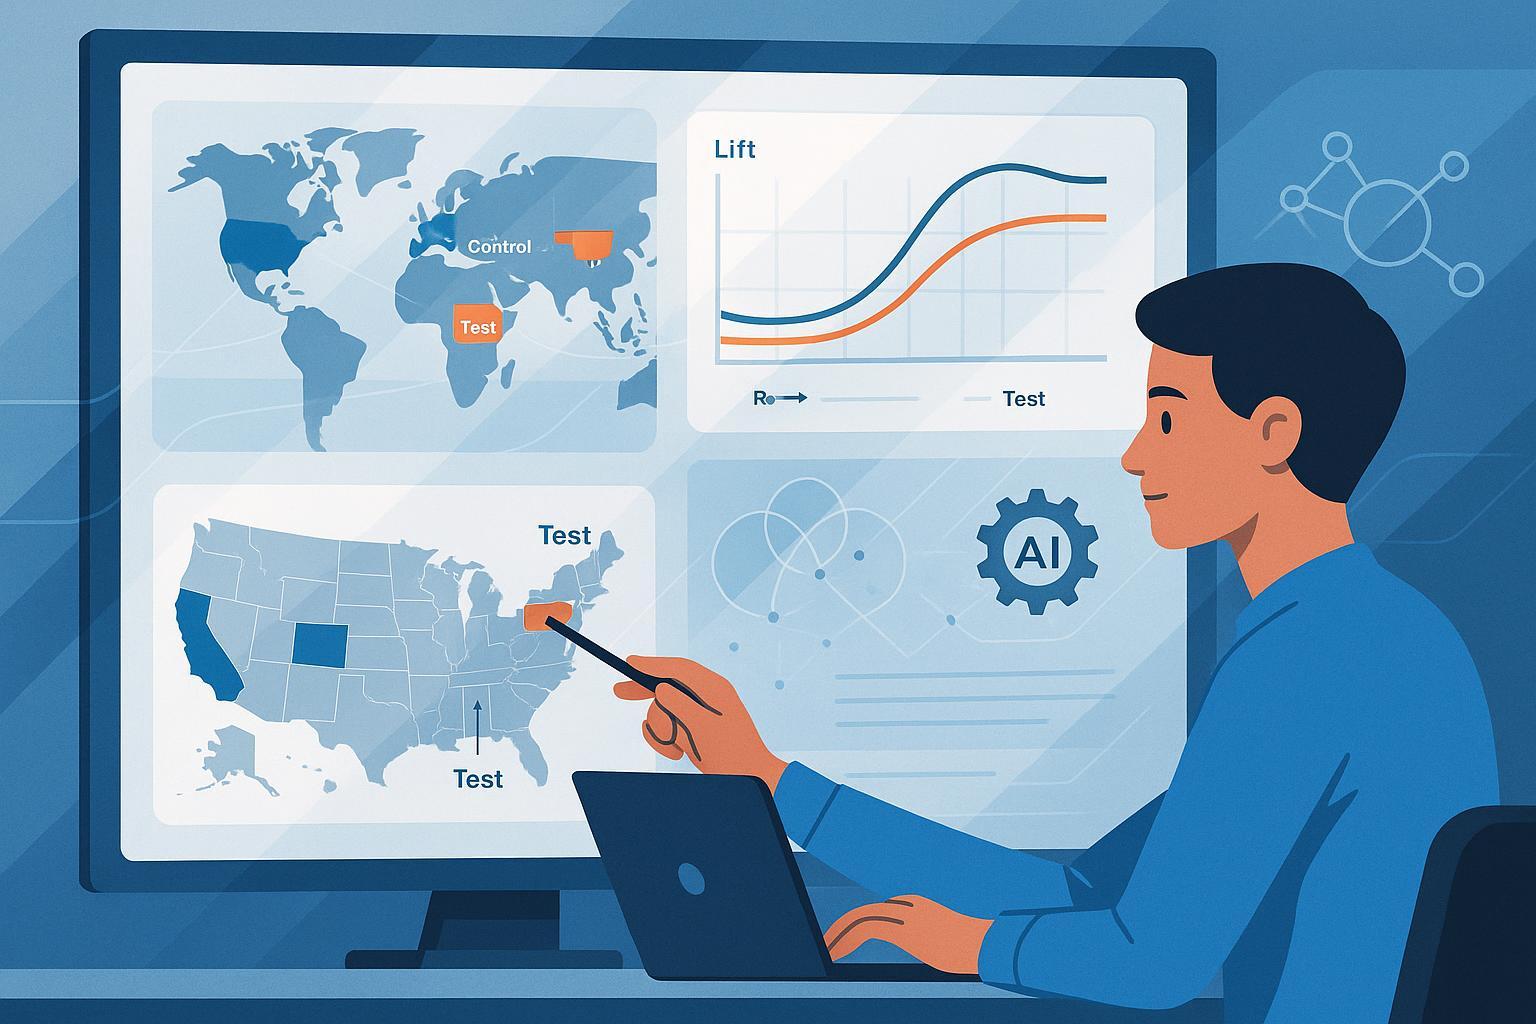
- Geo: You divide your audience by geography—say, zip codes or cities. Run ads/content in some locations but not others, then measure the changes. It’s like turning your marketing plan into a natural experiment.
- PSA (Public Service Announcement): Instead of a blank control, show a neutral or unrelated message (often a public service ad) to the control group. This helps to isolate the true effect of your campaign by holding all other variables constant (Bidease Q&A on Incrementality, 2025).
Causal Lift vs. Attribution: What’s the Difference?
Attribution (like last-click, multi-touch, or platform models) tries to assign credit for outcomes based on user journeys—but often relies on correlations, not hard evidence. Causal Lift requires experimenting: If you didn’t run the campaign, what would’ve happened? Correlation isn’t enough—only experimental or quasi-experimental designs capture true incrementality (Segwise.ai Incrementality Table, 2025).
How Does a Geo/PSA Lift Experiment Work? (Step By Step)
Let’s walk through a real SaaS/content scenario:
- Select Regions or Audience: Pick comparable geographic areas or audience segments. For SaaS, think markets with similar lead gen patterns.
- Randomize Assignment: Randomly designate which regions/audiences get your content push, and which get only PSA or no campaign.
- Launch Your Campaign: Run ad/content for the test group, PSA or holdout for the control.
- Collect Outcome Data: Track KPIs—leads, demo requests, downloads, or sign-ups.
- Analyze Lift: Compare post-campaign performance. The difference (adjusted for confounders) is your incremental causal lift.
Example: SaaS Demo Campaign With Geo Holdout
A B2B SaaS firm wants to measure real demo lift:
- Design: Split US cities into test and control; run targeted demo ads only in test zones.
- Result: Test cities yield a 15% higher demo rate than controls, after adjusting for baseline and seasonality—proving true campaign impact (Right Side Up, 2023).
Demystifying the Stats (Without the Jargon)
- Randomization: Prevents accidental biases. Ensures the comparison is apples-to-apples.
- Intent-to-Treat Analysis: Measures EVERYONE as assigned—even if they didn’t engage. Keeps the experiment honest and interpretation valid (inBeat Agency, 2025).
- Statistical Power & Duration: You need enough people (sample size) and time to detect real differences—especially for smaller SaaS/content campaigns.
- Synthetic Controls & Bayesian Modeling: Advanced tricks to build a more accurate ‘virtual control group’—critical for low-volume or noisy data. These methods are increasingly automated by modern AI-driven martech platforms (Haus.io, Synthetic Controls for Incrementality, 2025).
Quick Table: Causal Lift vs. Common Attribution Models
| Method | What It Measures | Pros | Cons | Best Use Case |
|---|---|---|---|---|
| Causal Lift (Geo/PSA) | True incrementality | Gold standard, robust to bias | Needs experiments, enough sample | Channel validation, real ROI |
| Last-Click Attribution | Path-based correlation | Fast, simple | Over-credits end, misleads strategy | Simple optimization |
| Multi-Touch Attribution | Journey path-based | Nuanced, multi-step story | Not causal, user data needed | Funnel analysis, online journeys |
| MMM (Media Mix Modeling) | Aggregate/long-term | No PII, offline channels too | Less granular, slower | Strategic, big-picture planning |
| Platform Attribution | Channel-specific | Easy, plugged-in | Often biased, lacks causality | Platform-level optimizations |
(Table adapted from authoritative sources including Segwise.ai, 2025 and Haus.io, 2025)
Key Trends Shaping Causal Lift in 2025
- Privacy-First Measurement: Modern experiments rely on aggregated geo data or synthetic controls—no user-level tracking. The latest frameworks are designed to comply with global privacy laws (Bidease, Measuring What Matters, 2025).
- AI/Automation: Platforms can now automate geo splits, synthetic control creation, and Bayesian lift estimation—making advanced analysis accessible for SaaS/content marketers with no data science background (Google Meridian MMM, 2025).
- Long Funnel & Low Volume: B2B SaaS journeys often mean fewer conversions and longer decision cycles. Bayesian pooling/statistical modeling help stabilize lift measurement in these scenarios.
Troubleshooting & FAQs for Practitioners
Q: What if you see negative or no lift?
- Double-check your experiment design, sample size, and run duration. Sometimes extending the period or refining geo matching helps.
- Use Bayesian models to both pool data and report uncertainty, not just point estimates (Polar Analytics, 2025).
Q: How do you design for long SaaS sales cycles?
- Measure multi-stage lift: lead gen, nurture engagement, and sales outcomes separately. Adjust experiment duration accordingly.
Q: Can you test causality with small audiences?
- Yes! Synthetic control and Bayesian hierarchical modeling are gamechangers for low-volume SaaS/content campaigns—pooling info across segments for more actionable measurement (Haus.io, Synthetic Controls, 2025).
Actionable Blueprint for SaaS/Content Marketers
- Map Your Audience: Segment by geo, audience, or funnel stage.
- Randomize and Assign Groups: Ensure test/control similarity.
- Design Control (PSA or Holdout): Choose neutral or unrelated messaging for controls.
- Run the Campaign: Track all KPIs (leads, demos, downloads).
- Analyze Using Advanced Methods: Consider synthetic controls/Bayesian estimation for stability.
- Report Uncertainty: Always share confidence intervals, not just absolute lift.
- Use Open-Source/Automated Tools: Leverage frameworks like Google’s Meridian MMM for ready-made experiment design (Google Meridian MMM, 2025).
Bringing It All Together
Causal Lift (Geo/PSA) flips the script on marketing measurement. Instead of asking “what might have worked?” you get scientifically valid answers to “what did work?” In the fast-evolving SaaS/content marketing world—where privacy, AI, and long-funnel journeys dominate—it is the gold standard for actionable, bias-proof ROI measurement. Embrace it, and turn your next campaign into a real-world experiment with confidence.
References & Further Reading