Attention Metrics: What They Are, Why They Matter, and How to Use Them

Introduction
If you’ve ever wondered why “viewable” ads don’t always move the needle, you’re already on the trail of attention metrics. Viewability tells you an ad could be seen; attention metrics aim to tell you whether a real person actually looked, for how long, and with what intensity. As industry standards evolve, attention is becoming a practical bridge between exposure and outcomes.
Key takeaways
- Attention metrics quantify human focus on ads or content—going beyond the mere opportunity to see. The IAB/MRC’s in-progress framework formalizes definitions and guardrails (2025 draft).
- Attention builds on viewability but isn’t guaranteed by it; the MRC’s viewability thresholds (e.g., 50% of pixels in view for 1s display/2s video) remain the baseline for qualified exposure.
- Evidence suggests attention-based measures correlate more strongly with brand and performance results than viewability or CTR alone (e.g., PwC’s 2023 validation of Lumen’s models).
- Use a cycle: Measure signals → Model attention at scale → Validate against outcomes → Optimize creative, placements, and cross-channel mix.
- Proceed thoughtfully: privacy, transparency, and over-optimization risks require clear standards, consent, and balanced KPIs.
What are attention metrics? A layered definition
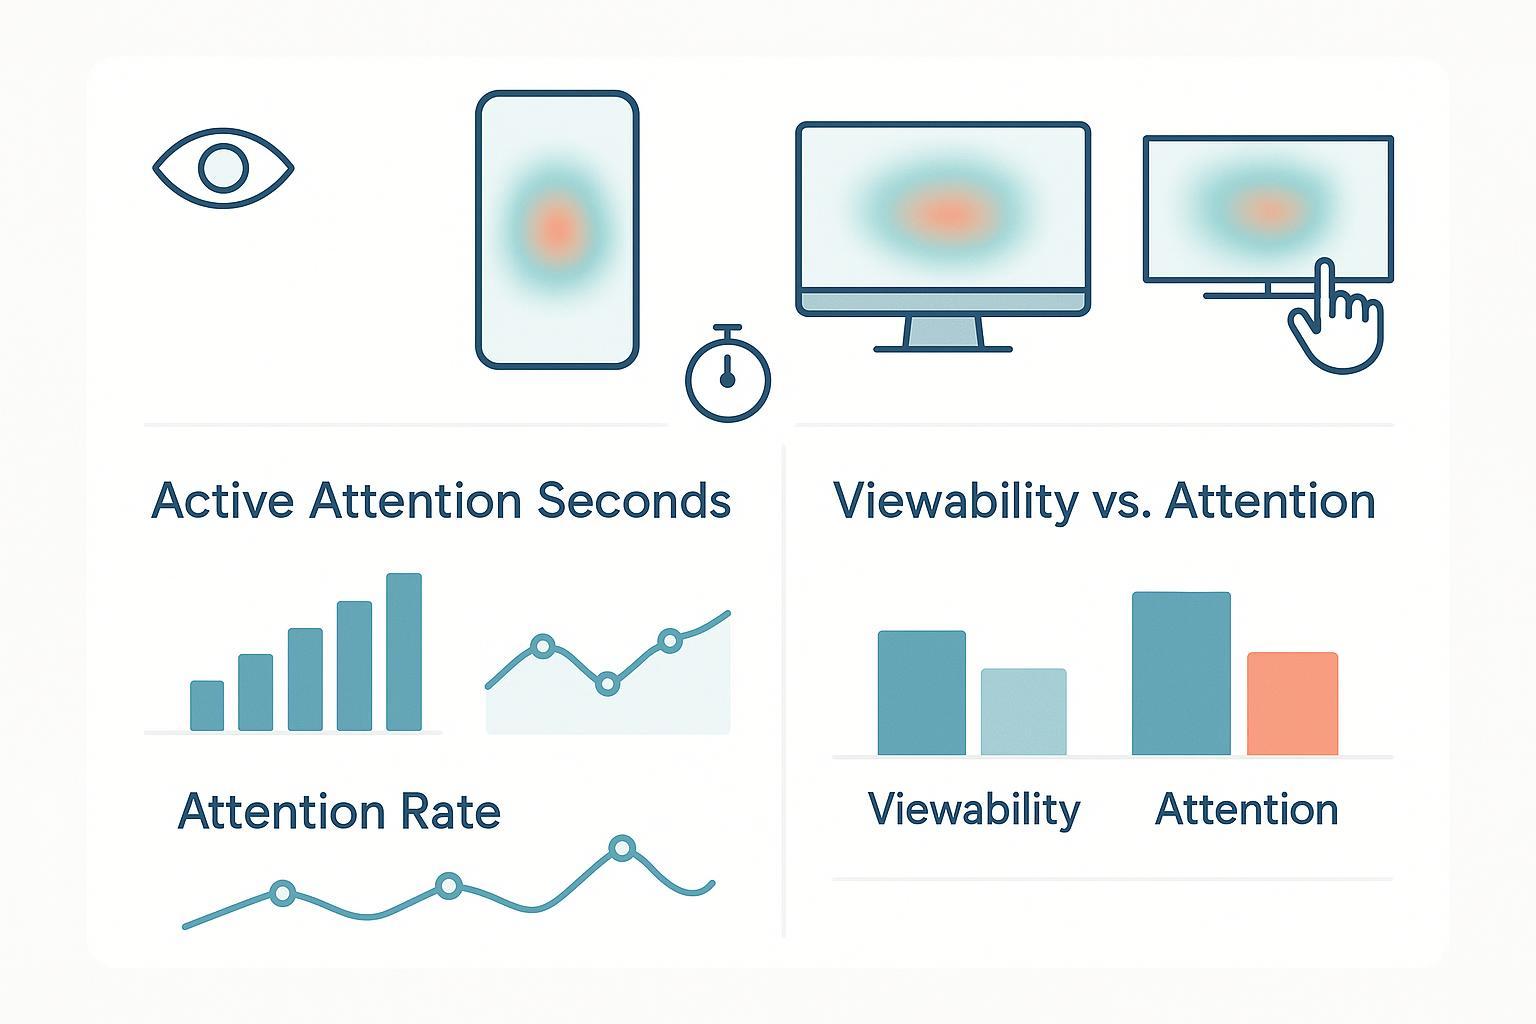
- Core definition: Attention metrics measure whether and how much a real person focuses on an ad (or piece of content), emphasizing quality and duration of attention rather than simple exposure. That often includes “active attention seconds,” attention rate, and modeled attention scores grounded in empirical signals.
- Standards context: The Interactive Advertising Bureau (IAB) and Media Rating Council (MRC) are shaping common terminology, documentation requirements, and methodological categories to make attention measurement more consistent across formats and devices. See the IAB/MRC attention measurement draft for public comment (2025) and the IAB’s plain-language explainer (2024) for foundational concepts.
- The 2025 public-comment draft outlines methodological guardrails across observed and modeled approaches; see the IAB/MRC Attention Measurement Guidelines (2025 draft).
- For a non-technical overview, the IAB’s Attention Measurement Explainer (2024) summarizes components and use cases.
- What it’s not: Attention is not reach, impressions, viewability, time-in-view, or engagement events (clicks, plays). These can coexist with attention but don’t prove that a human actually focused on the ad.
Attention vs. viewability: the boundary that matters
- Viewability (opportunity to see) is codified by MRC/IAB thresholds: for display, at least 50% of pixels in view for a minimum of 1 continuous second; for video, 50% of pixels in view for at least 2 continuous seconds. These are the MRC viewable impression guidelines and remain the baseline for “qualified” exposure.
- Attention focuses on human focus and processing—e.g., active attention seconds, gaze probability, sustained viewing, and interaction context. The IAB/MRC attention draft positions attention as building on top of viewability, not replacing it.
| Concept | What it tells you | Typical thresholds/signals | What it doesn’t prove |
|---|---|---|---|
| Viewability | Ad met exposure conditions (opportunity to see) | MRC thresholds (e.g., 50% pixels for 1–2s) | That a human looked or processed the ad |
| Attention | Human focus/processing quality and duration | Active attention seconds, attention rate, gaze probability, modeled scores | Guaranteed outcomes (lift, conversions) |
For canonical references, see the MRC Viewable Impression Guidelines (ongoing standards) and IAB/MRC Attention Measurement Guidelines (2025 draft).
What gets measured: common attention metrics and signals
Typical attention metrics include:
- Active attention seconds (time when a viewer is demonstrably focused)
- Passive attention seconds (nearby presence with lower engagement quality)
- Attention rate (share of qualified exposure time with attention)
- Gaze/visual attention probability (from eye-tracking panels or models)
- Interaction-derived attention (scroll stops, hovers, expands, sound on, play/pause)
- Modeled attention scores (composites combining multiple signals)
Signals and data sources:
- Observed (direct): eye/gaze tracking in panels or consented environments, audibility, device/player events. See vendor primers describing observed attention and methodology.
- Modeled (inferred): statistical/ML models trained on observed datasets to score attention for impressions at scale. Methodologies are discussed by attention vendors and verification suites that incorporate attention proxies.
- Standards lens: The IAB/MRC draft emphasizes transparency on what signals are used, how models are trained, and how validation is performed across contexts.
Authoritative and vendor perspectives to explore:
- The IAB Attention Measurement Explainer (2024) describes component signals and measurement paths.
- Method summaries from providers like DoubleVerify (2024) and Adelaide’s AU metric overviews outline exposure-intensity plus interaction cues and their modeling approaches.
- Amplified Intelligence details human-observed attention techniques and panel-based methodologies.
How attention is measured: a practical mini-framework
Think of attention measurement as a repeatable cycle you can adopt regardless of vendor stack:
- Measure
- Ensure qualified exposures (apply MRC viewability rules; filter invalid traffic).
- Capture signals available in your environment: time-in-view, share of screen, audibility, motion, scroll behaviors, and (where consented) direct attention observations.
- Model
- Where you can’t observe attention directly at scale, use validated models trained on observed datasets (panel eye-tracking, controlled studies) to predict attention for each impression.
- Document inputs, training data, and limitations; align with the transparency guidance in the IAB/MRC draft (2025).
- Validate
- Link attention metrics to outcomes: brand lift studies, A/B tests, incrementality tests, or marketing mix modeling. Studies indicate attention metrics often outperform viewability alone at predicting results—e.g., PwC’s 2023 validation of Lumen’s attention technology reported stronger links to CTR/conversions than viewability.
- Optimize
- Buy toward higher predicted attention per dollar (e.g., attention-adjusted CPM or quality tiers).
- Iterate creative for early capture (first 1–3 seconds) and sustained attention through key message moments; practitioner notes from verification providers detail tactics such as front-loading branding and motion.
- Normalize attention units across channels (display, social, CTV) to inform budget allocation, consistent with the IAB’s cross-media comparability aims.
Practical applications and examples
-
Media buying and planning
- Use attention-adjusted quality scores to prioritize PMPs, placements, or formats with better predicted attention per cost. For instance, planning frameworks like Adelaide’s AU introduce a single cross-channel quality indicator that can inform bidding and mix decisions.
-
Creative optimization
- Test variants to capture attention quickly and hold it through the core message. Verification providers’ attention explainers describe tactics such as prominent visual entry points, motion within the focal area, and minimizing visual clutter that competes with the brand asset.
-
Cross-channel comparability
- Normalize attention units—such as active attention seconds—across social feeds, open web video, and CTV to compare efficiency. The IAB/MRC draft highlights cross-media comparability as a central objective for future standardization.
-
Attention-informed KPIs
- Example threshold for an awareness flight: “At least 1.5 active attention seconds for 60% of qualified impressions,” with periodic validation against brand lift and consideration.
Public cases to explore for inspiration:
- An NBA case study reported higher tune-in rates (e.g., 36% uplift) for audiences exposed to high-AU placements versus low-AU, illustrating how attention-informed buying can relate to outcomes (Adelaide, 2023).
- Coca-Cola tests (Aquarius and Coke Zero) reported sizable gains in ad recall and impact when optimizing toward AU compared with viewability-optimized tactics (Adelaide, various markets).
What the evidence says (and doesn’t)
- Multiple sources indicate attention metrics correlate better with brand and performance outcomes than viewability alone. PwC’s 2023 validation of Lumen’s attention technology found stronger predictive power for CTR and conversions than traditional proxies.
- Neutral bodies such as the Advertising Research Foundation (ARF) have convened multi-year initiatives to validate and compare attention methods, with ongoing results shared at events like ARF ATTENTION 2024 and AUDIENCExSCIENCE 2025.
- Important caveat: attention does not guarantee outcomes. It is a higher-quality exposure indicator, not an outcome metric. Always tie attention thresholds back to brand lift or incremental performance tests within your category.
For primary sources and context, see the IAB/MRC attention draft (2025), IAB’s explainer (2024), and public research from Lumen/PwC (2023) alongside ARF event papers.
Limitations, risks, and ethics
-
Standardization is evolving
- As of 2025, the IAB/MRC attention guidelines are in public comment; vendor definitions and models can differ. Align to the latest drafts and demand clear documentation.
-
Privacy and consent
- Direct attention signals (e.g., webcam/eye-tracking) require explicit, transparent consent and compliance with regional data laws. Apply data minimization and clear user disclosures.
-
Model portability and bias
- Panel-trained models may not generalize across formats, regions, or creative types. Recalibrate with fresh validation and disclose limitations, as urged in the IAB/MRC draft.
-
Implementation nuances
- Inactivity rules, background tabs, and auto-play environments can distort signals if not standardized. Ensure your partners document how they treat session state and player behavior.
-
Over-optimization risk
- Chasing attention alone can incentivize intrusive formats or clickbait creative. Balance attention KPIs with brand safety, suitability, user experience, and outcome metrics.
FAQ and mythbusting
-
Does attention replace viewability?
- No. Viewability remains the baseline for qualified exposure; attention builds on it to indicate human focus.
-
Is time-in-view the same as attention?
- Not exactly. Time-in-view is exposure duration; attention requires evidence of human focus (observed or modeled).
-
Do attention metrics guarantee sales lift?
- No. They are better exposure quality indicators, but you must validate thresholds against outcomes for your category.
-
Is eye-tracking required to use attention?
- Not always. Many systems use models trained on panel eye-tracking, combined with exposure and interaction signals, to score impressions at scale.
-
Can I compare attention across social, open web, and CTV?
- That’s the goal. The IAB/MRC workstream aims for cross-media comparability, but methods are still converging; use normalized units carefully and document assumptions.
Related terms (and how they differ)
- Viewability: exposure opportunity per MRC thresholds; prerequisite, not proof of attention.
- Time-in-view / dwell time: how long the ad was on screen; not inherently human focus.
- Engagement metrics: clicks, plays, hovers; interactions that may signal attention but aren’t synonymous with visual attention.
- Brand lift: outcome measures (e.g., recall, awareness, consideration) used to validate whether attention proxies matter for your brand.
Further reading
- IAB/MRC Attention Measurement Guidelines (2025 draft) — definitions, taxonomy, and transparency guardrails.
- IAB Attention Measurement Explainer (2024) — non-technical overview of attention concepts and components.
- MRC Viewable Impression Guidelines — canonical viewability baselines for display and video.
- PwC’s validation of Lumen’s attention technology (2023) — evidence linking attention models to outcomes.
- ARF ATTENTION 2024 and AUDIENCExSCIENCE 2025 — neutral forums for comparative research and validation.
- Methodology and practice perspectives: DoubleVerify’s attention explainer, Adelaide’s AU resources, and Amplified Intelligence’s primer on human-observed attention.
—
As of 2025-09-13, the attention measurement standards are still being finalized. Keep your program flexible: document your definitions, insist on transparency from partners, validate against outcomes, and optimize with user experience in mind.