The shift from volume to value in AI search is changing how content marketers measure success (2025)

Updated on 2025-10-03
Why this shift matters now
AI-generated answers are taking center stage in search and discovery. In 2025, Google broadened access to AI Overviews and introduced AI Mode with more advanced reasoning and multimodality—"our most powerful AI search"—as described in the Google AI Mode announcement (2025). As answer-first interfaces mature across Google, ChatGPT, and Perplexity, traditional SEO proxies like rankings, organic sessions, and average CTR increasingly undercount brand impact.
Multiple 2025 datasets show the behavioral and visibility changes behind this reality:
- Semrush’s March 2025 study measured AI Overviews in 13.14% of U.S. desktop searches, predominantly informational queries, with continued presence through midyear.
- Pew Research (July 2025) observed that when an AI summary appears, users clicked traditional links in 8% of visits vs 15% without summaries; only about 1% clicked links inside the AI summary. The study was U.S.-based and limited in scope, but it underscores a directional shift.
- Ahrefs analysis suggests position-1 CTR drops when an AI Overview is present, estimating a reduction in the 30–35% range across a large keyword set.
- Citation concentration is uneven: BrightEdge data summarized by Search Engine Land (Oct 2025) shows YouTube holding a 29.5% citation share in AI Overviews and 16.6% in AI Mode, highlighting the advantage of multi-format content.
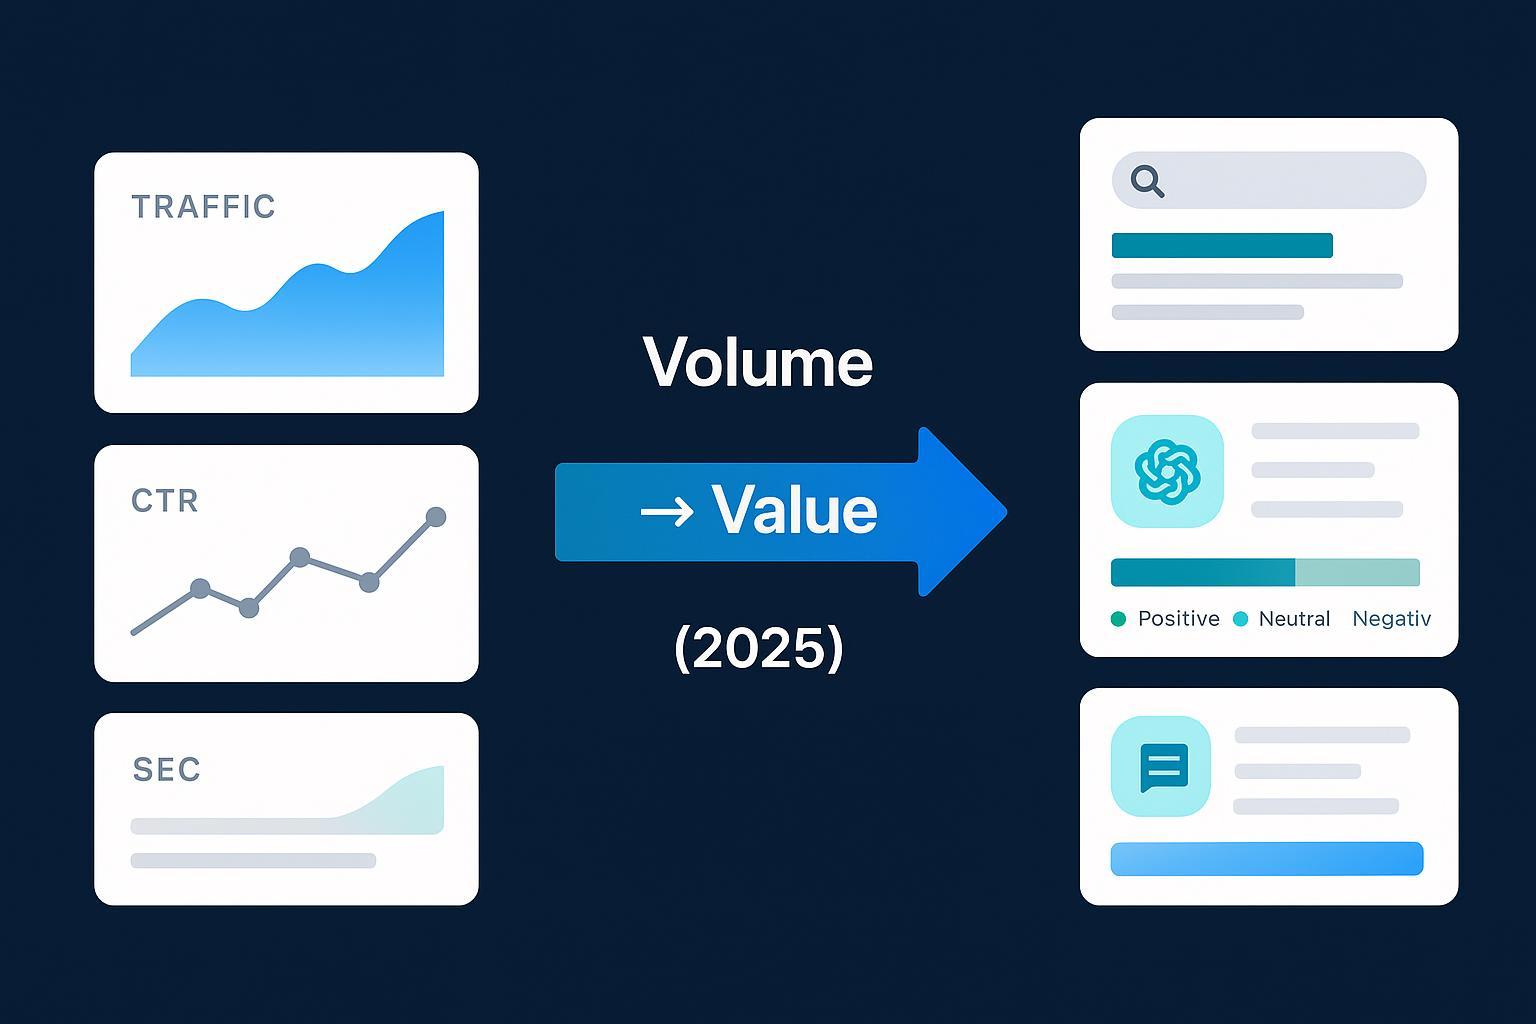
Combined, these signals imply that measuring success by sheer volume (sessions, clicks) misses how value is created inside AI answers. Brands need new KPIs that reflect visibility, authority, and influence—even when no click occurs.
From SERP metrics to AI-native KPIs
Classic SEO metrics remain useful, but they’re lagging indicators in answer-led environments. A practical KPI stack for 2025 reframes success around inclusion, authority, sentiment, and downstream impact.
Share of Citation (SoC)
- Definition: Percentage of AI responses that cite or mention your brand/content for a defined query set.
- Formula:
SoC = (AI responses citing your brand ÷ Total AI responses for the query set) × 100 - Why it matters: Platforms concentrate citations among domains that signal authority (e.g., YouTube, Wikipedia, official docs). Tracking your citation share is a competitive visibility proxy across Google AI Overviews/AI Mode, ChatGPT, and Perplexity.
Answer Presence Rate (APR)
- Definition: Rate at which your content is included as a source in AI answers for monitored queries.
- Formula:
APR = (AI answers including your content ÷ Total AI queries analyzed) × 100 - Why it matters: APR serves as a replacement for “average position.” Segment APR by intent (how-to, comparisons, definitions) for clearer optimization priorities.
Brand Sentiment in AI Answers
- Definition: The proportion of positive/neutral vs negative brand mentions inside AI answers for high-intent queries.
- Example formula:
Sentiment Score = (Positive mentions ÷ Total mentions) × 100(optionally weighted by platform or intent). - Why it matters: Sentiment affects trust and conversion likelihood; coordinate monitoring with PR/comms.
Assisted Conversions from AI-influenced journeys
- Definition: Share of conversions where users had prior exposure via AI answers (assessed via micro-surveys, direct/referral matching, promo-code cohorts, or modeled attribution).
- Example formula:
Assisted Conversion Rate = (Conversions with AI exposure ÷ Total conversions) × 100 - Why it matters: With reduced click propensity near AI summaries (as Pew’s 2025 study suggests), attribution must capture influence beyond immediate clicks.
Measurement glossary quick view: SoC, APR, AI Sentiment Score, and Assisted Conversion Rate form the “value” layer; use diagnostics like chunk retrieval frequency and embedding relevance to troubleshoot why answers include or exclude your content. See Google’s developer guidance on structuring content for AI search in the May 2025 “Succeeding in AI search” post.
Where AI Overviews show up most—and why it changes your content mix
Informational-heavy categories have the highest prevalence of AI Overviews and answer summaries. Semrush’s intent distribution in early 2025 skewed ~88% informational across triggered queries, which explains category leaders like Health, Science, and People & Society. Law & Government and Travel also see notable coverage. While exact vertical percentages aren’t fully public, the implication is clear:
- Health and Law/Gov: Emphasize authoritative citations (expert-reviewed content, clear sourcing, structured FAQs). Provide verifiable facts and definitions that LLMs can quote or reference.
- Travel and Ecommerce: Blend destination facts with comparison tables and multimedia; invest in short-form video given YouTube’s citation advantage summarized by Search Engine Land in 2025.
Example workflow: Building a SoC + APR dashboard
To operationalize these KPIs, create a cross-platform visibility dashboard that monitors citation share and answer presence for your priority topics.
- Step 1: Define topic clusters and intent. Select informational how-tos, comparison pages, and definitive resources.
- Step 2: Track inclusion across Google AI Overviews/AI Mode, ChatGPT, and Perplexity. Log whether you are cited in references and/or used in the body.
- Step 3: Instrument sentiment checks for brand mentions; flag negative mentions for PR follow-up.
- Step 4: Tie cohorts to conversions. Add micro-survey options (“AI answer/chat app”), promo codes linked to monitored topics, and watch for branded direct spikes.
Using an AI visibility tool like Geneo can help aggregate citations, mentions, and sentiment across platforms into a single view. Disclosure: Geneo is our product.
- Configure a topic set, set windows (e.g., rolling 28 days), and benchmark against top competitors.
- Monitor SoC and APR, plus diagnostics like chunk retrieval frequency and embedding relevance.
- For context, review an example report on GDPR fines 2025, which illustrates platform presence, linkbacks, and sentiment fields.
A simple journey map to capture assisted outcomes
AI exposure → branded search/direct visit → internal search/tool use → conversion
- Instrument events for internal site search and interactive tools/calculators.
- Cohort promo codes by topic (e.g., TRAVEL-AI-2025) to attribute uplift.
- Survey “first discovery” with AI answer/chat app as an explicit option.
Operational tips and governance
- Re-baseline KPIs by topic: For information-led clusters, replace “organic sessions” goals with APR ≥ target and SoC ≥ target. For commercial clusters, measure assisted conversion rate tied to AI exposure.
- Content refresh SLAs: Version definitive resources and FAQs; maintain freshness to sustain retrieval and citations.
- Multi-format investment: Pair authoritative text with short-form video and structured data (FAQs, steps, comparisons) to improve chunkability and citation likelihood.
- Quarterly AI visibility review: SEO, Content, PR, and Analytics meet to prune low-value pages, consolidate duplicates, and strengthen source-of-truth assets.
What to watch next (Q4 2025–Q1 2026)
- Google’s ongoing AI Mode and Overviews UI/coverage adjustments—track changes against APR and SoC.
- Platform citation mix shifts: Watch if YouTube’s share moderates or if other domains rise, affecting your content format priorities.
- New datasets from Semrush/Ahrefs and behavioral updates from Pew or other research bodies—refresh benchmarks every 4–6 weeks.
Closing
If your reporting still treats traffic as the north star, you’ll miss where value is accruing: inside AI answers and the downstream journeys they influence. Reframe your success metrics around inclusion (APR), authority (SoC), reputation (Sentiment), and outcomes (Assisted Conversions)—then build the instrumentation to see it.
Ready to evaluate your AI visibility and citations across platforms? Visit Geneo to explore how AI answer monitoring can fit into your measurement stack.
Change-log
- 2025-10-03: Initial publication citing Google AI Mode (2025), Semrush prevalence (2025), Pew behavior (2025), Search Engine Land citation distribution (2025), Ahrefs CTR impact (2025).