AI-Driven CRM Automation in 2025: How to Unify Customer Data and Predict At‑Risk Clients for Better Engagement

If you’re still stitching together spreadsheets and one-off dashboards to spot churn risk, you’re operating blind. In 2025, teams that unify customer data and operationalize AI-driven risk prediction are seeing faster interventions, tighter retention loops, and clearer accountability across Sales, Marketing, and Customer Success. Based on multiple CRM/CDP deployments and iteration cycles, this guide distills what consistently works, where it breaks, and how to stand up a production-grade workflow in months—not years.
According to the McKinsey State of AI (2025), adoption remains broad, with most enterprises applying AI in at least one function; the differentiator now is scale and operationalization, not experimentation. See the adoption discussion in the McKinsey State of AI 2025 report.
Define the Target State Before You Buy Anything
What “good” looks like in practice:
- A unified, consent-aware customer profile (golden record) that merges CRM objects, product usage, support, billing, and marketing interactions.
- Transparent identity resolution rules and match rates you trust.
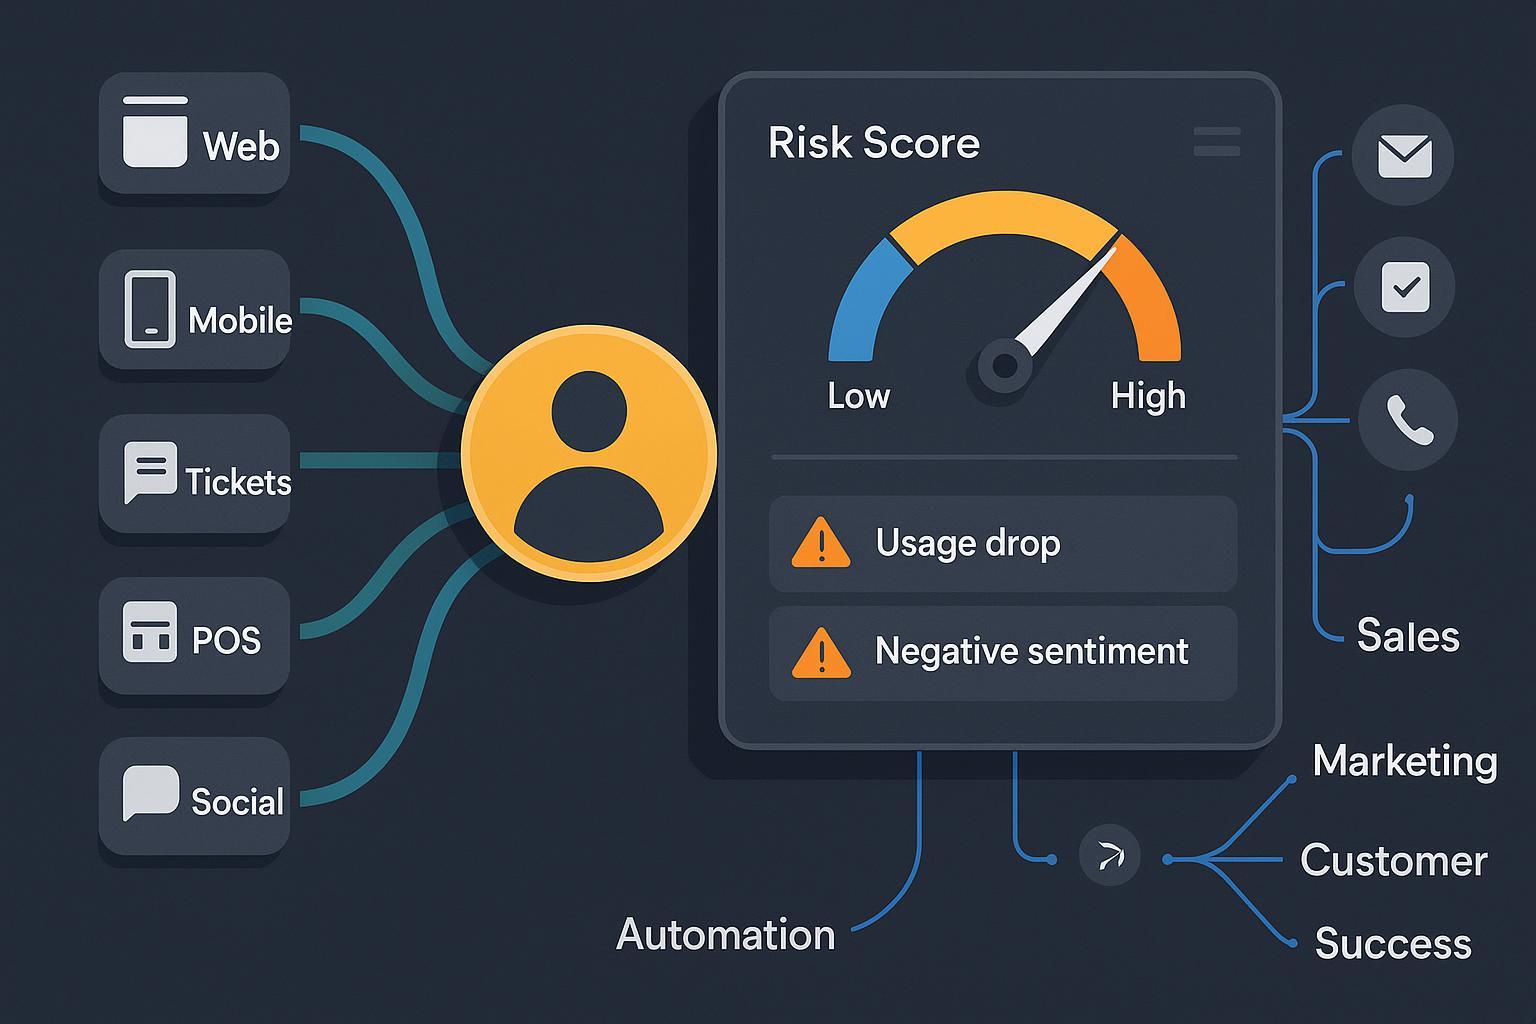
- A churn/risk score and top drivers surfaced inside the CRM for every account or contact.
- Automated, channel-appropriate interventions that trigger when risk exceeds thresholds, with humans in the loop for high-impact accounts.
- A closed feedback loop: outcomes (save/loss, offer acceptance, CSAT change) flow back to retrain and recalibrate models.
This is not about a single tool. It’s a system: data unification + predictive modeling + orchestration + governance.
Architecture: Unify Data Without Rebuilding Your World
In 2025, the cleanest pattern pairs a CDP (or composable profile service) with your CRM. The CDP builds the real-time unified profile; the CRM remains the system of engagement for Sales/CS. As CMSWire’s explainer clarifies, a CDP is designed for unification and activation, while the CRM operationalizes day-to-day relationship workflows; they’re complementary roles, not substitutes. For a concise functional distinction, see the CMSWire overview, “What’s the difference between a CRM and a CDP—and why you should care” (CMSWire, accessed 2025).
Practical blueprint (minimal viable architecture that scales):
- Ingest
- Stream key product/usage events, support tickets, and web/app behaviors to your CDP or event pipeline.
- Batch-load CRM, billing, and historical data weekly or daily until you mature.
- Identity resolution
- Start deterministically: email, user ID, account domain + billing identifiers. Set explicit match confidence tiers (e.g., exact vs. normalized).
- Document reconciliation rules (which source wins for each attribute) and measure match rates by segment.
- Profile store and lakehouse
- Keep your real-time profile in the CDP or profile service; land raw and curated data in a lakehouse (Snowflake/Databricks/Azure) for analytics and ML.
- Activation
- Push resolved profiles, segments, reason codes, and risk scores back to CRM objects and CS/marketing tools in near real-time.
- Governance by design
- Maintain consent and policy flags with the profile. Enforce field-level policies (e.g., suppress outreach without consent) through orchestration.
Proof you can get there with mainstream stacks: Salesforce’s Data Cloud has expanded connectors and zero/low-copy patterns, including support for unstructured signals like call transcripts (press release dated 2024-09-17). Review the scope of data types and activation paths in the Salesforce Data Cloud unstructured data announcement. Adoption momentum also accelerated into 2025; see Salesforce’s update on customer growth and use cases in Salesforce’s 2025 Data Cloud growth overview.
Field rule: Don’t chase “perfect” unification. Aim for a reliable 70–85% match coverage on your revenue-critical segments as a starting line, then iterate.
Modeling: Predict At‑Risk Clients You Can Actually Save
Churn and risk models only matter if they drive actions your team can take. In production, we’ve found the following practical approach most durable:
-
Start with features tied to controllable actions
- Behavioral: 30/60/90-day declines in usage depth, login frequency, or feature adoption.
- Support: spike in tickets, negative CSAT, unresolved severity.
- Commercial: reduced order frequency/size, upcoming renewal window, discount sensitivity.
- Sentiment: classifier output from support transcripts, NPS verbatims, reviews.
-
Choose model families that balance performance and explainability
- Tabular models (gradient boosting, logistic regression) for stability and interpretability.
- Augment with NLP embeddings for sentiment features when available.
-
Calibrate and threshold for ops
- Calibrate probabilities (e.g., Platt/Isotonic) so a 0.7 score consistently means ~70% risk.
- Choose thresholds by segment based on intervention capacity (e.g., CSM bandwidth) and expected value uplift.
-
Operationalize MLOps from day one
- Versioned feature store to avoid training–serving skew.
- Model registry with champion–challenger to safely test upgrades.
- Drift monitoring (PSI/KS), AUC/PR tracking, and quarterly retraining cadences.
- Cost-aware deployment patterns; serverless or scale-to-zero for inference endpoints where latency allows. For a cost control pattern on managed inference, see “scale down to zero in Amazon SageMaker Inference” (AWS blog, 2024).
-
Don’t reinvent the wheel when your platform has it
- Many suites ship starter churn models. Microsoft’s Dynamics 365 Customer Insights includes a configurable churn predictor and integrates with Journeys for activation; see the “Predict transactional churn” documentation (Microsoft Learn, 2025) for inputs, tuning, and outputs.
For monitoring model outputs and understanding drivers at profile level, vendor guidance like “Customer AI model details and monitoring” (Adobe Experience Platform docs, accessed 2025) is a useful reference—especially for how to surface propensity alongside reasons in engagement tools.
Orchestration: From Risk Score to Accountable Action in the CRM
The handoff from “insight” to “intervention” is where value is created. Hard-won practices:
-
Route by reason code, not just score
- “Usage decline” triggers product education and in-app guides.
- “Service dissatisfaction” triggers escalation, manager callback, and SLA remediation.
- “Price sensitivity” triggers retention offer logic, but only with consent and within policy.
-
Meet teams where they work
- Surface scores and top drivers on account/contact pages in the CRM. Attach playbooks to the object (tasks, call scripts, email templates).
- For named accounts, trigger CSM tasks with due dates and checklists; for long-tail, trigger lifecycle journeys in your marketing tool.
-
Define capacity-aware thresholds and queues
- Maintain separate thresholds for enterprise vs SMB segments.
- Use work queues and ownership rules so no alert dies in a feed.
-
Close the loop
- Record action taken, response, and final outcome on the CRM object.
- Feed these back to the feature store/CDP to retrain models and update playbooks.
A simple, durable workflow pattern:
- Risk score and reason codes updated hourly/daily on the CRM record.
- Flow/automation checks: if score > threshold AND consent/policy allow, then:
- Create task to owner with playbook + deadline (high value accounts).
- Enroll in targeted journey with content matched to reason code (scaled segments).
- Log intervention and wait for outcome event (e.g., product usage recovery, ticket CSAT improved, offer accepted).
- Update health score and adjust cadence; escalate if no improvement by SLA.
Governance and Compliance: Build Trust Into the System
You don’t need to be a lawyer, but you do need guardrails. The north stars in 2025:
-
Automated decisions with significant effects require human involvement and transparency under GDPR Article 22. The CJEU’s 2024 SCHUFA line of cases broadened what can count as automated decision-making. For a practitioner-friendly summary, see the “CJEU decision on automated decision-making under GDPR” analysis (Matheson, 2024).
-
In the U.S., enforcement emphasizes transparency and fairness. The FTC’s AI resources hub aggregates guidance and cases—use it to calibrate your disclosures, testing, and claims. Start with the FTC’s AI hub (U.S. Federal Trade Commission, accessed 2025).
-
California’s CPRA is advancing Automated Decisionmaking Technology (ADMT) regulations in 2025. Expect obligations around risk assessments, disclosures, and opt-outs for significant decisions/profiling. Track current status on the California Privacy Protection Agency regulatory updates page (CPPA, 2025).
Operationalize compliance:
- Perform and document DPIAs/risk assessments for profiling models; record lawful basis and purpose limitation.
- Provide clear notices about profiling and meaningful information about logic and impact.
- Keep humans in the loop for renewals, pricing, and other high-stakes outcomes.
- Offer opt-outs where required; build an appeals channel.
- Test for bias across protected classes; maintain audit trails for features, models, and interventions.
Phased Rollout With Realistic Timelines and KPIs
Based on multi-implementation experience, this cadence is achievable for midmarket teams with executive sponsorship and a small cross-functional pod (RevOps, Data, CS, IT):
-
0–90 days: Foundations
- Stand up ingestion for top-5 sources (CRM, product events, support, billing, web analytics).
- Implement deterministic identity resolution; measure and publish match rates by segment.
- Define minimum viable profile schema and consent flags; expose a read API.
- Ship v0 risk model using 6–10 high-signal features; calibrate; publish a daily score to CRM.
- KPI targets: 70% match coverage on target segments; AUC ≥ 0.72; data freshness ≤ 24h.
-
90–180 days: Orchestration and learning loop
- Attach reason codes to model outputs; map playbooks by reason.
- Automate interventions for long-tail; route enterprise to CSM tasks.
- Instrument outcomes: capture action taken, response, and result; wire feedback to feature store.
- KPI targets: 60%+ of alerts acted on within SLA; 10–20% lift in save rate on treated cohort vs control.
-
180–365 days: Scale and hardening
- Expand features to include sentiment and advanced usage signals.
- Deploy champion–challenger models; quarterly retrain; add drift/bias dashboards.
- Introduce segment-specific thresholds and capacity management.
- KPI targets: Net retention uplift measurable at segment level; reduction in false positives; CSAT improvement in at-risk cohort.
Note on budgets and staffing: Ranges vary by stack and starting maturity, but successful midmarket programs typically operate with a lean core team (3–6 FTE equivalent across RevOps, Data/ML, and CS enablement) plus platform licenses and integration services. The limiting factor is almost always decision rights and process adoption—not model code.
Industry Nuances You Shouldn’t Ignore
-
- Signals: feature activation milestones, seat utilization, admin logins, support backlog, executive sponsor engagement.
- Interventions: success plans tied to value milestones; enablement sprints; usage-based nudges; executive QBRs.
-
Telco/Subscription
- Signals: drop in usage days, network issues by location, billing disputes, competitor offers.
- Interventions: proactive service credits, technician dispatch, plan optimization. Telecoms often lean on real-time next-best-action; industry overviews discuss measurable retention improvements, including personalized offers and network-aware outreach. See the World Economic Forum’s “AI in Telecommunications 2025” report for context on decisioning patterns.
-
- Signals: basket abandonment frequency, order value decay, delivery issues, returns and complaints, loyalty inactivity.
- Interventions: service recovery offers, replenishment reminders, channel rebalancing (email/SMS/app) based on preference and consent.
Adjust your thresholds by unit economics. A 5% false-positive rate might be fine in low-cost email journeys but unacceptable for high-touch CSM escalations.
What Usually Goes Wrong (and How to Recover)
-
Over‑engineering identity resolution
- Symptom: months spent perfecting fuzzy logic with minimal incremental business value.
- Fix: lock deterministic rules, publish match-rate dashboards, and iterate in parallel with orchestration.
-
Spurious correlations and black‑box models
- Symptom: chasing seasonal patterns or promotional artifacts; teams don’t trust or act on scores.
- Fix: blend interpretable models with reason codes; validate uplift via controlled holdouts.
-
Automation overreach
- Symptom: fully automated pricing or cancellation decisions backfire or breach policy.
- Fix: define human-in-the-loop zones and require approvals for high-risk actions; align with legal.
-
No capacity planning
- Symptom: too many alerts for CSMs; SLAs missed; morale dips.
- Fix: segment thresholds and queueing; measure “alerts acted within SLA” as a primary KPI.
-
Monitoring gaps
- Symptom: model decay, rising false positives, or biased outcomes go unnoticed.
- Fix: implement drift and bias dashboards; run champion–challenger; schedule quarterly reviews.
Evidence That Platforms Are Ready (Used the Right Way)
If you stay pragmatic, you can move quickly using out‑of‑the‑box capabilities:
- Salesforce’s Data Cloud and Einstein stack are adding data types and tighter activation across Sales/Service/Marketing; the company highlighted expanded adoption and use cases into 2025 in its Data Cloud growth overview.
- Microsoft’s Customer Insights provides a guided churn prediction workflow tied to orchestration; details in the Predict transactional churn doc (Microsoft Learn, 2025).
- For model monitoring and driver visibility patterns, Adobe’s guidance in “Customer AI model details and monitoring” (accessed 2025) maps cleanly to production needs.
These aren’t silver bullets; they’re accelerators when matched to a clear target state and governance.
Minimal Governance Checklist (Pin It Next to Your Kanban)
- Data and identity
- Document sources, match rules, and reconciliation precedence.
- Track match rates and freshness by segment; set SLAs.
- Consent and policy
- Store consent status and channel preferences on the profile; enforce at activation.
- Honor regional requirements (e.g., EU, California) consistently.
- Modeling
- Record features, training data ranges, and model lineage.
- Bias testing and explainability reviews before promotion.
- Operations
- Human-in-the-loop for significant decisions (renewals, pricing, cancellations).
- Audit trails for who acted on which alert and why.
- Legal/compliance references
- Bookmark the FTC’s AI hub (accessed 2025) for U.S. guidance and enforcement trends.
- Track California ADMT rulemaking via the CPPA regulatory updates page (2025) and coordinate internal policy updates accordingly.
- For EU contexts, review commentary on the CJEU’s 2024 stance on automated decision-making, for example the Matheson analysis of GDPR Art. 22 decisions.
Put It All Together: A Practical Implementation Playbook
-
Align on the target state and KPIs
- Define “save” outcomes and the lift you need to justify investment. Choose KPIs you can measure within 90 days (match rates, AUC, SLA adherence, save-rate lift in treated cohorts).
-
Land your minimum viable data spine
- Ingest top-5 sources. Implement deterministic identity. Publish a profile read API and a daily risk score back to CRM.
-
Ship a controllable model
- Start with interpretable features and clear reason codes. Calibrate and choose thresholds aligned to team capacity.
-
Orchestrate with guardrails
- Map playbooks by reason code. Gate high-impact actions behind human approval. Enforce consent at activation.
-
Instrument the feedback loop
- Log actions, outcomes, and delays. Retrain quarterly and compare champion vs challenger.
-
Scale deliberately
- Add richer features (e.g., sentiment). Segment thresholds by value and capacity. Expand channels only when you can measure incremental lift.
Final Word
AI-driven CRM automation pays off when you prioritize operational clarity over tool-chasing: unify only the data that changes decisions, model only the risks you can act on, and automate only where you can measure lift and stay compliant. Do that, and your teams will spend less time guessing and more time saving customers.